Those long-time readers of the Desk know of my special affinity (some would call it an obsession) with the Commonwealth of Pennsylvania. Throughout 2015 and 2016, I tracked voter registration changes as it finally ceased its long role as “Lucy’s Football” for the GOP, and continued to keep an eye on figures well beyond that fateful November. So, what do the numbers show, so far this year?
I want to stress that voter registration always drops from Presidential cycles. People die, move, forget to re-register, etc, and the figures for both parties are inevitably going to fall as you move further and further way from the race for the White House. Back in November of 2016, over 3.8 million Democrats and about 3.08 million Republicans were actively registered. Fast forward to February of this year, and those figures had shrunk to 3.62 million for the Democrats and 2.99 million for the Republicans. Even in active years, like 2018, you may see a small decline from start to finish as we are still drifting away from such a monumental cycle.
Accounting for the expected small declines post-Presidential cycle, there have been some noticeable changes. The first involves party flipping. From 2009 through 2016, we saw a nearly unbroken string of months where non-Republicans elected to flip towards Team Red more than non-Democrats elected to flip toward Team Blue. A net 95,000 Pennsylvanians shifted to the right. This trend continued, narrowly, in 2017, with a net 3600 doing so. But so far in 2018, it’s going in the other direction, with a net thousand Pennsylvanians shifting to the left. It’s far to0 early to tell if this is just a blip, but the party switching that had been favoring Republicans has, at least for now, paused.
Looking through 2018’s figures, here’s how the active registration counts have changed, net, for the Democrats over the Republicans:
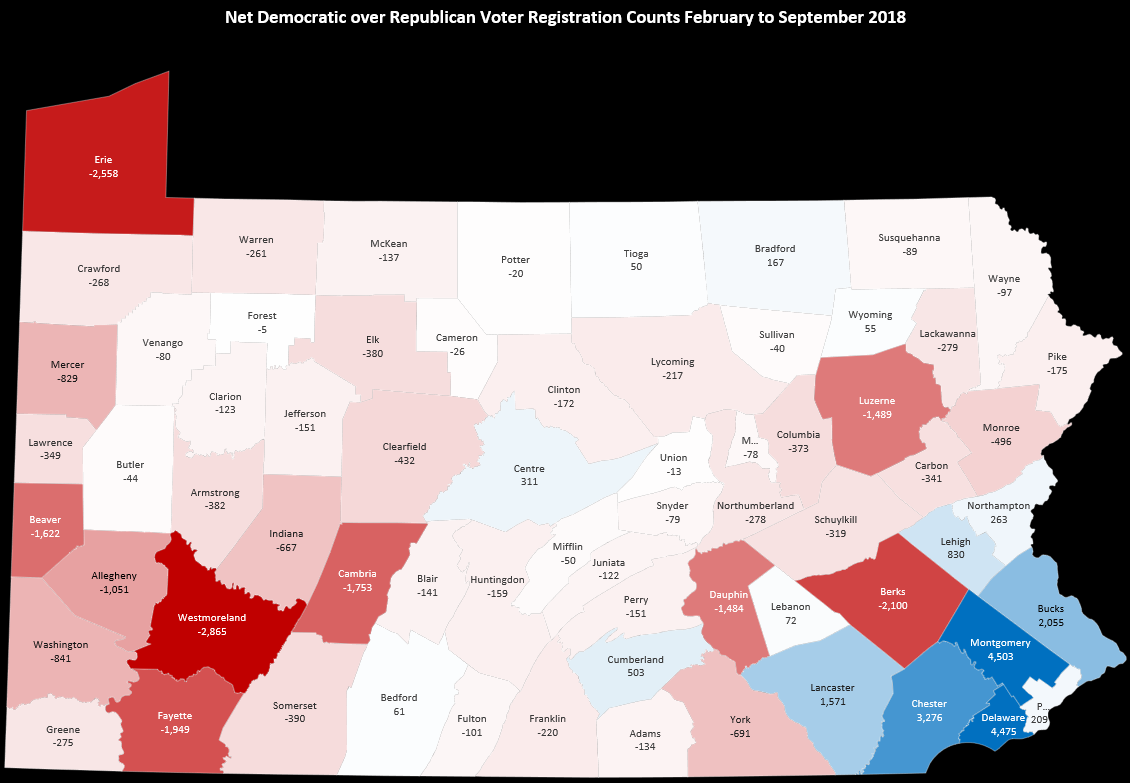
At first, this map looks great for the Republican Party: bright red spots in Berks, Erie, northeastern and southwestern Pennsylvania. It almost looks like the sort of shifts we saw through 2016 that aided President Donald Trump in his win despite serious losses in the Philadelphia Collar.
But again, this is the net change, party over party, so it can be quite misleading. The map looks red in a lot of spots, but that’s because the number of Democratic drop offs simply exceeded Republican drop offs. This wasn’t, in much of the state, a result of voter roll growth. Here’s what just the gains for each party look like, with shrinkage scaled in gray and growth in their respective partisan colors:
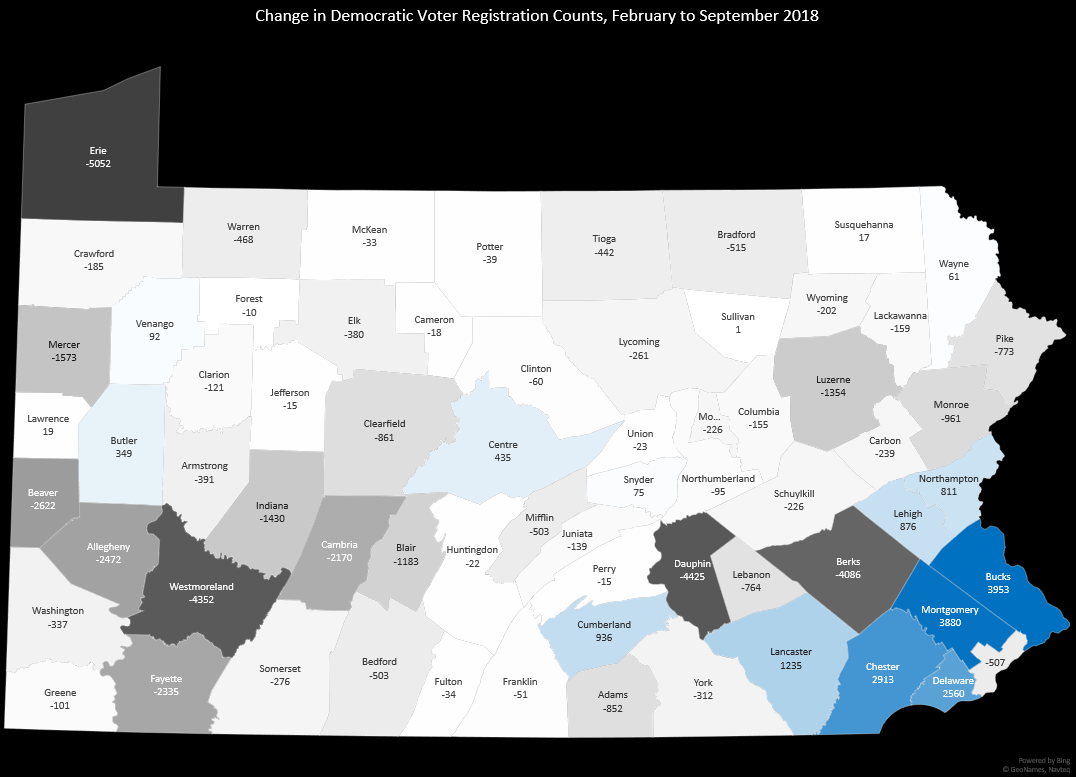
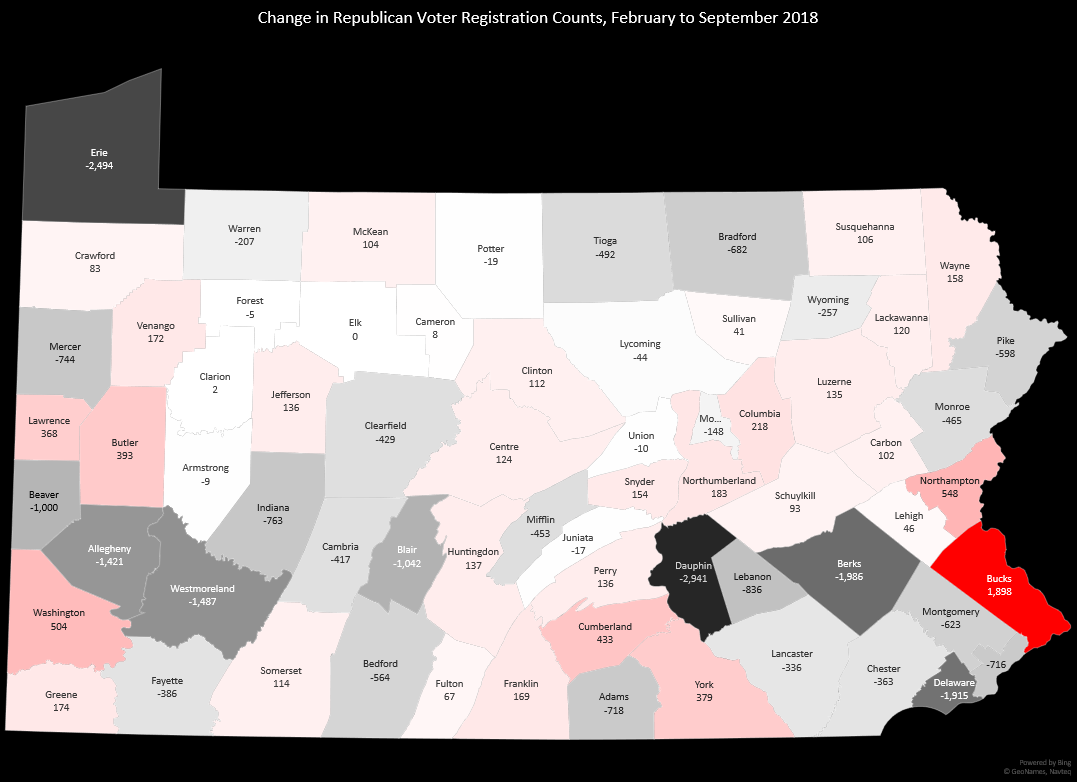
There were some modest gains for the GOP in areas of interest to them: York County continued its registration growth, Washington County still seems to be moving rightward, and they even made small progress in northeastern Pennsylvania, which shifted hard in 2016. But few of these areas feature hotly contested Congressional races. Indeed, if you’re looking at the new Congressional boundaries:
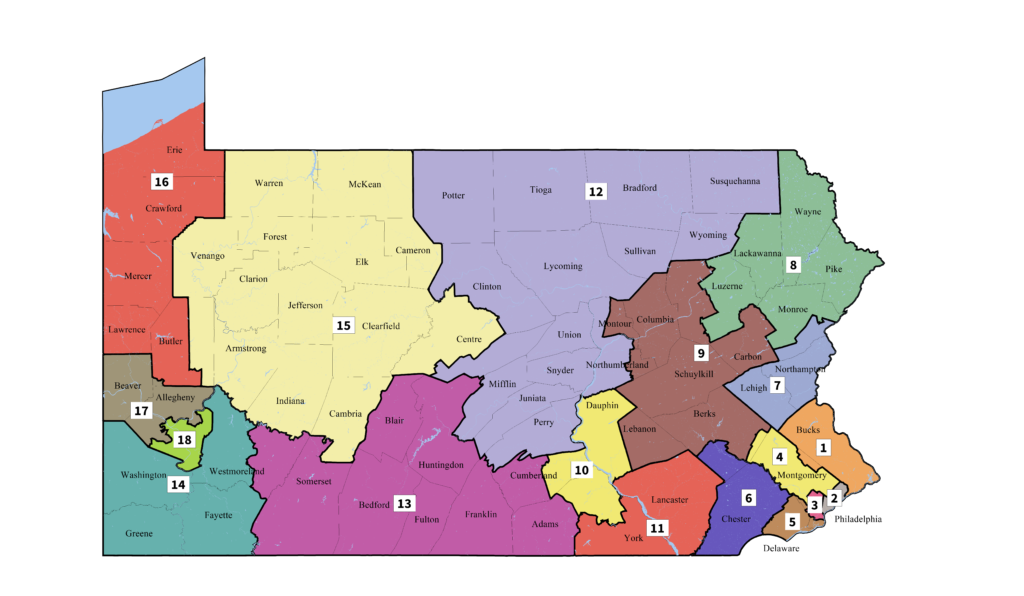 then these gains for Democrats (coupled, outside of Bucks, with Republican shrinkage) in southeastern Pennsylvania lends credence to stronger Democratic campaigning in Districts 1, 4, 5, 6, and 11. Positive voter registration changes are occurring in the state, but it is mostly confined to hotly contested seats- all of which Republicans now hold- and Democrats appear to be the benefactors, with six weeks to go until election day.