Earlier today, FiveThirtyEight released their much-anticipated Senate model. We thought it’d be interesting to see how the Øptimus model predictions compare to theirs. The numbers below are all based off of our 9/11 model update and FiveThirtyEight’s Classic model as of this afternoon.
The two models work in very different ways- and we won’t get too far into that element today. But at their core, they both use ballot test polling along with fundamentals of the race to assign probabilistic predictions for each Senate race. They both then run simulations using these individual race probabilities to estimate the chances of either party having control of the chamber.
That last part is where the two models deviate the most- while both have a mean prediction of 51 GOP seats to 49 Democratic seats, we have an 83% chance of GOP majority, while theirs currently sits at 66.1%. The difference is caused by different simulation techniques- with our model being much more confident in that mean prediction, and FiveThirtyEight having more spread than our model as a result.
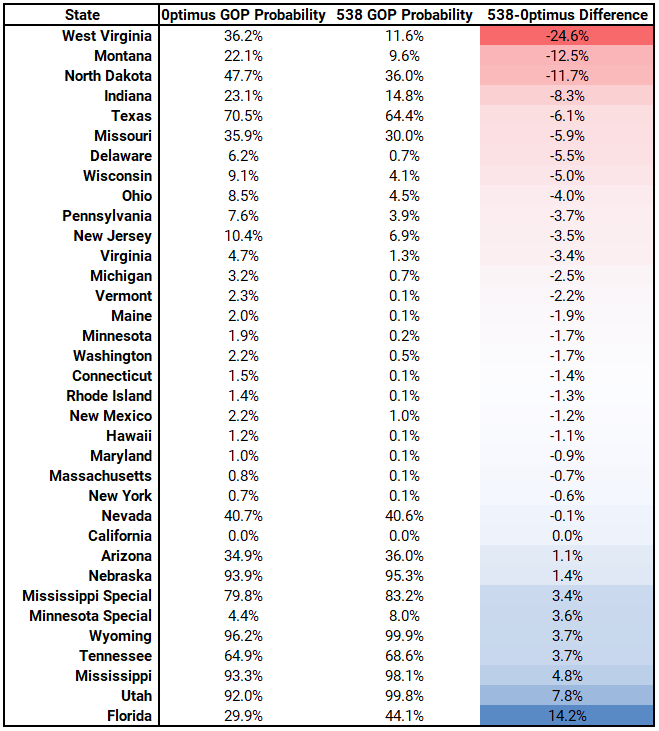
As for the individual seats, the table below summarizes differences there. Differences highlighted in red mean we are more bullish on GOP chances than FiveThirtyEight, and blue means we are more bullish on Democratic chances than their model.

It’s great to see where we currently agree to a tee (Nevada, Arizona) and where we disagree (we’re higher on GOP chances in WV, MT, and ND, and higher on Dem chances in FL). We’ll see how the model predictions shake out over the next 7 weeks.