On Sunday, July 21st, in the early afternoon, a letter was posted from President Joe Biden’s X account declaring his withdrawal from the 2024 Presidential Race. Shortly after, another post from X said that Biden would endorse VP Kamala Harris for the Democratic nomination.
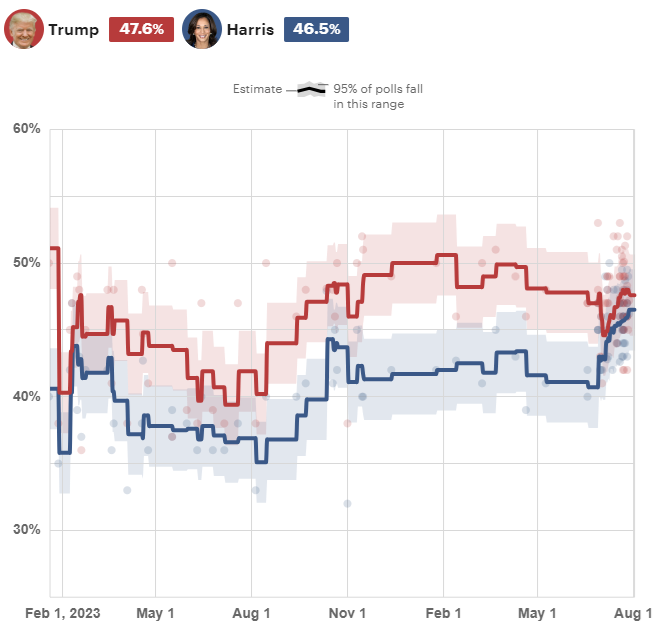
The election had been turned upside down a few times in the weeks prior, so another turn felt within reason. From that moment, Harris quickly secured support from all party corners. Now that we have a solid amount of polling with a Harris v. Trump matchup, we see that what once was a strong Trump polling lead has moved back to a virtual dead heat. In addition to the polling changes, we’ve seen countless online calls set up by the Harris campaign, bringing in hundreds of millions in donations.

We’ve also seen a sharp contrast in voter registration habits among Democrats. The last is particularly interesting because it shifts a trend that has remained steady since January 2021.
Voter Registration Across America
Thirty states, including the swing states of Pennsylvania, North Carolina, Nevada, and Arizona, register voters by requiring a political party designation. If voters refuse to choose a party, they’ll remain unaffiliated. The National Voting Rights Act (NVRA) allows states to conduct voter maintenance up to 90 days before a Federal election. Hence, it’s quite common to see registration drop between elections as states clean up their voter rolls and then ramp up quickly with 3-4 months to go before election day.
In November 2020, these 30 states had more than 121 million registrations; through July 2024, they had more than 119 million registrations. The loss of 2 million voters due to voter roll clean-ups is not surprising, but what has been surprising is how this loss has been distributed between political parties. Below is a breakdown of total registration by party in November 2020 vs. July 2024.
| Democrats | Republicans | Other | TOTAL | |
| November ’20 | 48,775,668 | 36,181,879 | 36,276,862 | 121,234,409 |
| July ’24 | 45,211,266 | 36,323,656 | 37,898,860 | 119,433,782 |
| CHANGE | -3,564,402 | 141,777 | 1,621,998 |
Following registration in these states weekly (some daily), the loss of Democratic voters has been remarkably consistent starting in January 2021. In 28/30 states, Republicans have net more voter registrations than Democrats (Colorado and California withstanding), and the pace at which Republicans were gaining had picked up. In the first 21 days of July, Republicans netted more than 225,000 registrations. Then, things turned on a dime.
Democrats Pick Up Speed
The change in registration trends was nearly instantaneous following Biden’s decision to drop out of the race. Take a look at some of the largest counties across the country and the changes in raw vote registrations for July (data pulled daily from county election websites):
| Clark (NV) | Maricopa (AZ) | Allegheny (PA) | Orange (FL) | |
| July 1 – 21 | R +1,477 | R +3,918 | R +847 | R +515 |
| July 22 – 31 | D +629 | D +1,488 | R +14 | D +622 |
For the first time in nearly four years, Democrats have started to gain in registrations across some of the larger populated counties. 10 days is not going to buck a trend that has been consistent for 44 months; however, Team Blue has its first cycle momentum and could turn this blip into something much larger with proper funding and focus.
What to Expect Leading Up To Election Day
The last few months before election day are always the most fruitful for voter registration. Based on state registration reports provided by election boards across all 50 states, there were more than 6 million new voter registrations in the three months leading up to election day in 2020. With Democrats having seen a boost in registration efforts, we’re much more likely to nestle against the same registration push we saw in 2020.
Two weeks ago, I would have said that Republicans were poised to continue their registration onslaught. Like everything else about this election, the road forward is uncertain today.