Now that Election Day is “over” (minus California and a few close races), we have a preliminary look at how our legislative model has performed. The following analysis only includes races that have been called, so it will change over the next few days.
This was our first dive into public forecasting- and we’re very pleased with how it’s turned out. The House model pretty much nailed it- and the Senate model seems to have held up exceptionally well.
Our final House prediction had Democrats at a 95.9% chance of taking control of the chamber. The mean prediction was 233 Democratic seats to 202 GOP seats, and the 90% confidence interval spanned from 218 Democratic seats to 248. Control of the House was called early in the night by most outlets and was only really in doubt at all due to jitters about early Senate results and some very sensitive live forecasts. The exact number of Democratic seats is left to be determined, but based on the current results, it looks like Democrats will end up between 229 and 234 seats.
On the Senate side, our final prediction gave Republicans a 91.9% chance of keeping control of the chamber. The mean prediction was 52 GOP seats to 48 Democratic seats, with a 90% confidence interval spanning from 49 GOP seats to 55 GOP seats. Assuming the Mississippi runoff goes as expected (Hyde-Smith leads Espy in the jungle primary, so she is now the overwhelming favorite in the runoff), the number of GOP seats stands at 53 or 54 (Arizona-dependent).
In terms of individual seats, our House model performed even better than we had anticipated based on backtesting.
One simple approach on judging the predictions is to cut them at 50% and see how many seats where we had Republicans or Democrats favored actually turned out going that way. In this framework, we were “wrong” on 10 House seats and 2 Senate seats, which translates to an out-of-sample accuracy of 97.6% and 94.1%, respectively. If you allow us a 5-point band from .5, where any predictions between 45% and 55% are thought to be pure toss-ups instead, we only missed 4 House seats and 2 Senate seats. And if we look at just races outside of toss-ups, we missed 4 House seats and 1 Senate seat (FL), giving us an accuracy of 99.1% in the House and 97.1% in the Senate among races where we saw one party favored over the other.
A different way of looking at it is through our categories. At the outset, we assigned bins to our prediction intervals based on backtests of the model. The bins were as follow:
Safe D: 0-10% chance of GOP victory
Likely D: 10-25%
Lean D: 25-40%
Toss-up: 40-60%
Lean R: 60-75%
Likely R: 75-90%
Safe R: 90-100%
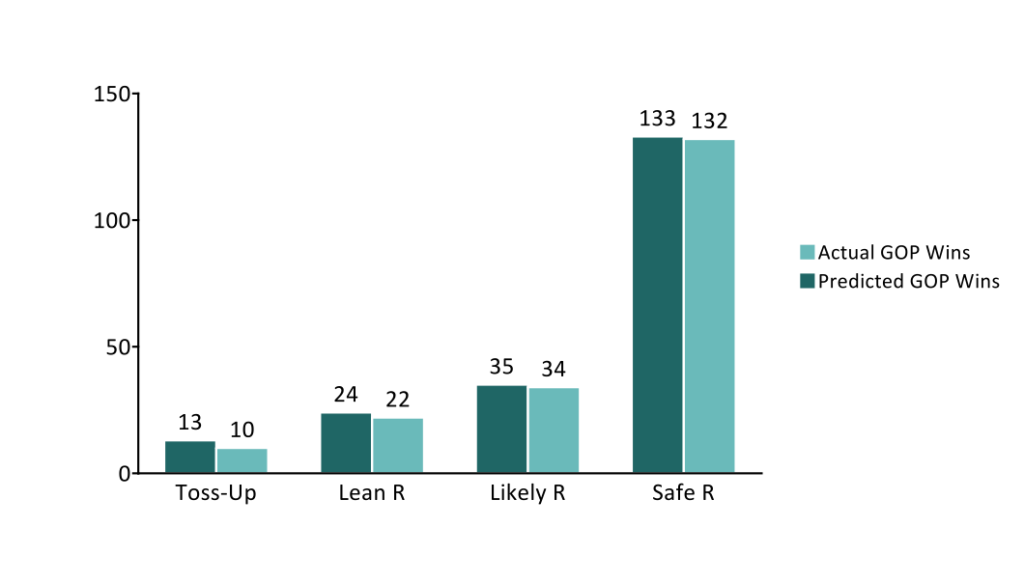
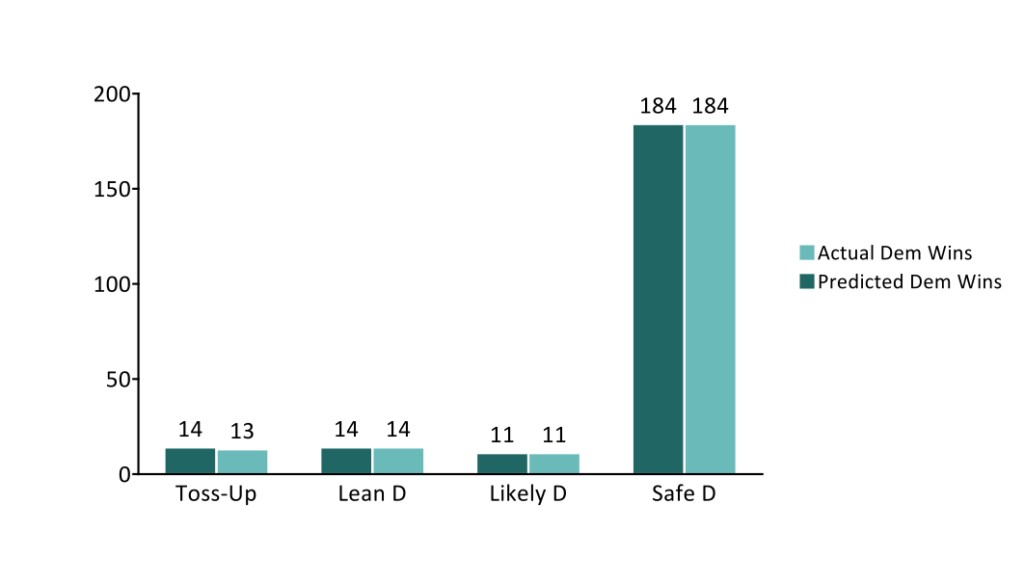
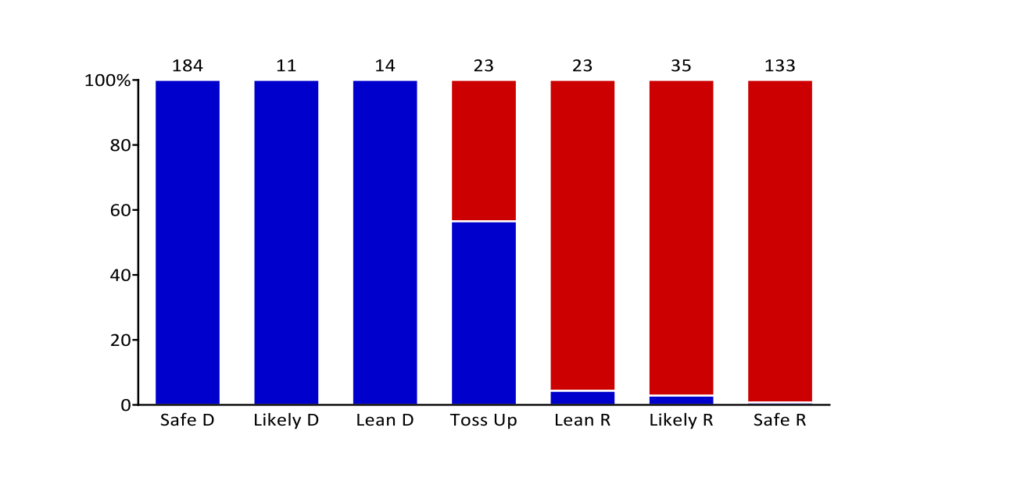
If we look within these bins, we see that they reflected the state of the races fairly well.
Predicted v. Actual Republican Seats

Predicted v. Actual Democratic Seats

Republican and Democratic Wins Across Predicted Categories

The sliver of blue on Safe R in the model above is OK-05. More to come as the week goes on and the remaining races are called…