I saw a conversation back and forth earlier this morning on the negative favorability ratings for nearly every Democratic nominee. A tweet by CNN contributor Harry Enten caught my eye:
YouGov’s latest poll: Dems lead the generic prez ballot by 49% to 40% over Trump, but none of the candidates (save Biden) have a positive net favorable score. (Schultz has by far the worst.) Most are not well known, & I’d bet a lot that this understates the “don’t know” for many. pic.twitter.com/FFtm9iM8mL
— (((Harry Enten))) (@ForecasterEnten) March 13, 2019
Our nation is incredibly partisan now, so even the strongest candidate either side could muster inevitably faces a weakening in the eyes of the public. This isn’t anything new, it’s been that way for nearly every Presidential election since I could vote.
Further, candidates often enjoy their strongest numbers before the first primaries are underway. The negative attacks have yet to start. The general election might as well be on another planet.
I went back through the last four Presidential elections to see how the eventual candidates were viewed by the public, both at the start of the year and in November. I averaged the five earliest polls conducted in or just before January, and the last five polls conducted before election day:
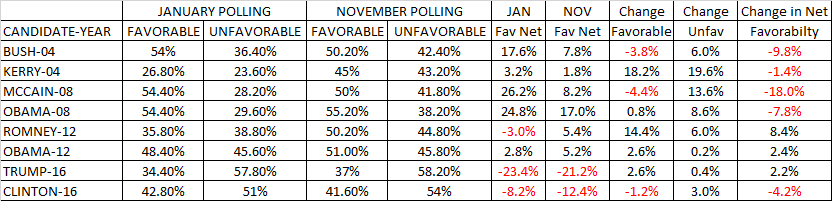
Only three candidates saw their net favorability grow: President Barack Obama in 2012, Donald Trump in 2016, and Mitt Romney in 2012. Of these, only Romney’s was an eyebrow-raiser, at 8.4%. Substantial positive changes in net favorabilty were an exception, not the rule.
The overall change in favorability has been rough on candidates. In 2008, Senator Barack Obama started of with an enviable net rating- as did fellow Senator John McCain. By year’s end, he’d see his favorable rating grow by less than 1% and his unfavorable grow by 8.6%. McCain’s nosedived (though remaining positive) and he lost by over eight points in the general election.
Now, this doesn’t mean that a Democrat with lackluster numbers right now can’t improve- Romney did- but odds are the numbers they start out with in January are, if they’re lucky, where they’ll end up by election season.
Polls used in January 2004: University of Pennsylvania/Annenberg, NBC News, CBS News, Newsweek, TIME
Polls used in Oct/Nov 2004: University of Pennsylvania/Annenberg, CBS News, NBC News, Fox News, Gallup
Polls used in January 2008: USAToday/Gallup, Pew Research, ABC News/Washington Post, CNN, NBC News
Polls used in October/November 2008: NBC News, Fox News, Rasmussen, Diageo Hotline, CBS News/New York Times
Polls used in January 2012: CBS News/New York Times, Pew Research, Fox News, CNN, ABC News/Washington Post
Polls used in October/November 2012: Politico/GWU/Battleground, Monmouth University/SurveyUSA, Fox News, CNN, ABC News/Washington Post
Polls used in December/January 2016: The Economist, Quinnipiac University, Public Policy Polling, Associated Press/GfK, ABC News/Washington Post
Polls used in October/November 2016 (all LVs): The Economist, Bloomberg News, Fox News, Monmouth University, NBC News/Wall Street Journal