The United States Census Bureau released the 2020 Census lower-level population data on Thursday, August 12th. The data includes official population and demographic figures for counties, cities, towns and all other relevant geographies. This release is four months later than usual because the Coronavirus pandemic delayed the collection and consolidation of population statistics.
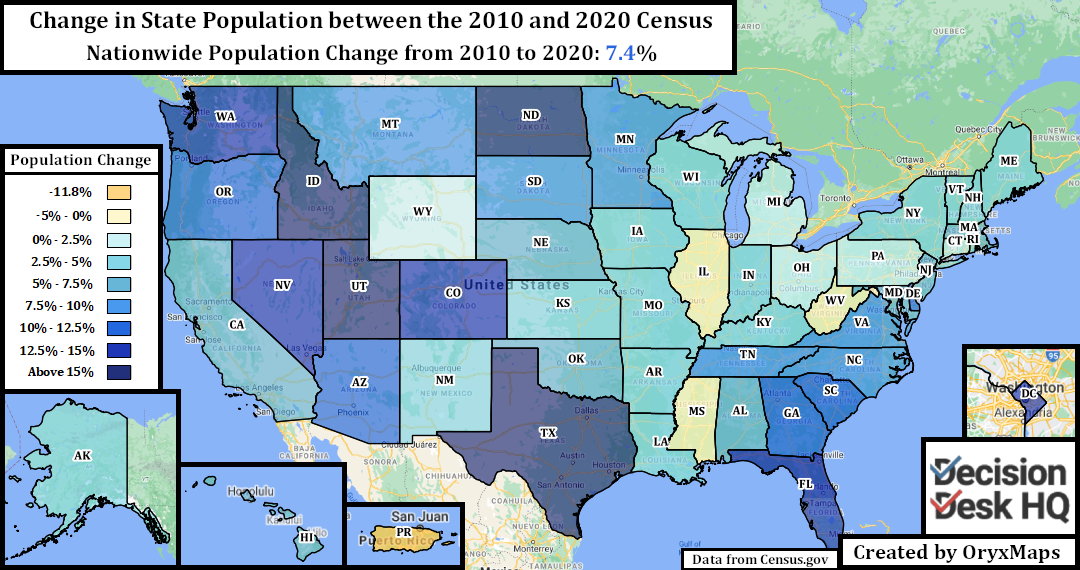
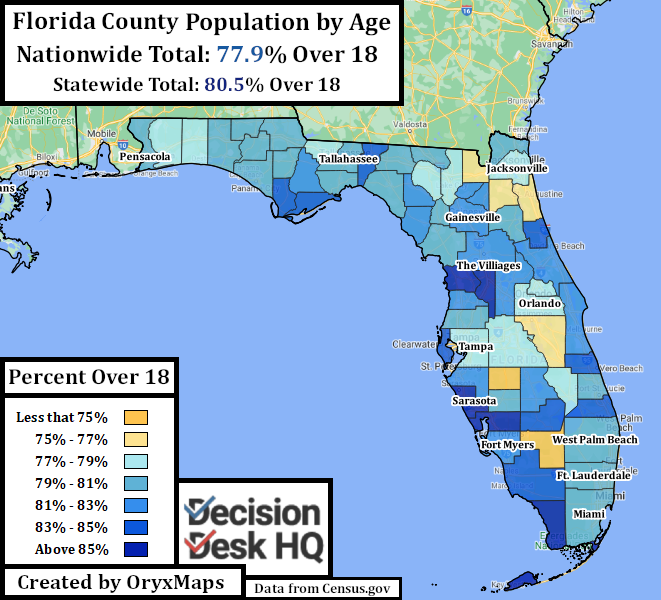
The 2020 Census counted 331.4 million people living in the United States, up from 308.7 million in 2010. This is the slowest ten-year period of population growth since the Great Depression. The overall population is ageing, with 77.9% of residents over 18, a 2% increase from 2010.
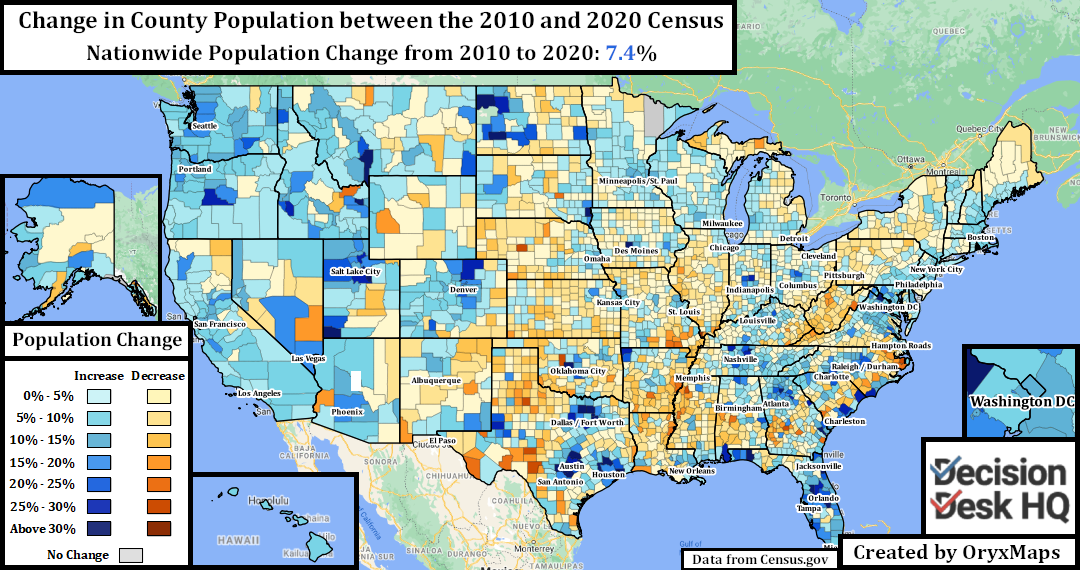
Despite a declining growth rate and data collection complications related to the Coronavirus pandemic, the six long-term trends of American population migration continued unabated. Gentrification and urban renewal continue to make cities attractive for young professionals. Cheap property, spacious homes, quality schools, and ample opportunity continues to attract people from all backgrounds and livelihoods to the expanding suburbs. Retirees continue to seek relaxation in the Sun Belt and scenic natural communities. Rural and post-Industrial America continues to decline as both the young and the old seek better lives in distant communities. African Americans continue to leave the blighted, post-industrial Midwest and impoverished Black Belt rural areas for southern cities teeming with opportunity. The overall population continues to grow less White, more diverse, and more intermingled.
Demographic Developments
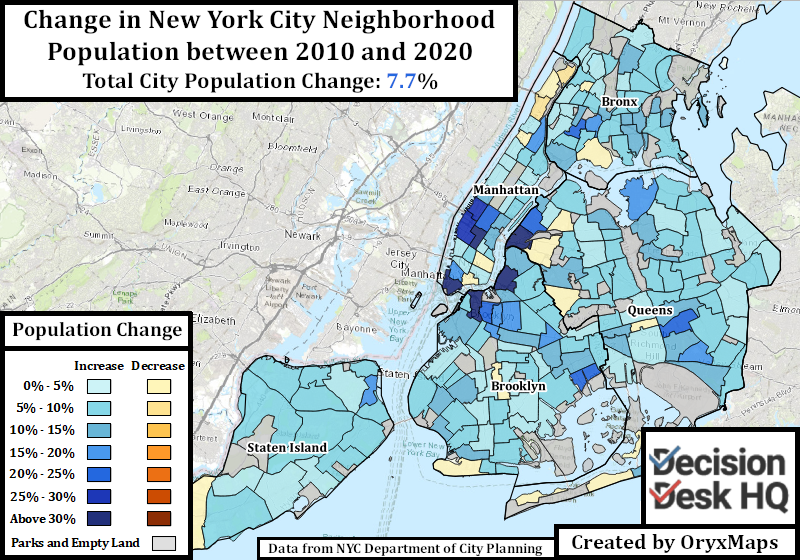
America’s largest cities are growing. Sun Belt cities grew comparatively faster than other urban communities, but cities like New York City, Boston, and Los Angeles added hundreds of thousands of people. This differs from the American Community Survey’s previous projections of stagnation. Smaller, affordable cities like Buffalo and Syracuse recorded their first growth since WWII. Young people want to live in cities for a variety of reasons, and this has led to strong growth in neighborhoods attractive to young professionals. This demographic is whiter than the national average, leading to decreasing minority populations even in urban centers with historically large minority populations like Washington D.C and Atlanta.
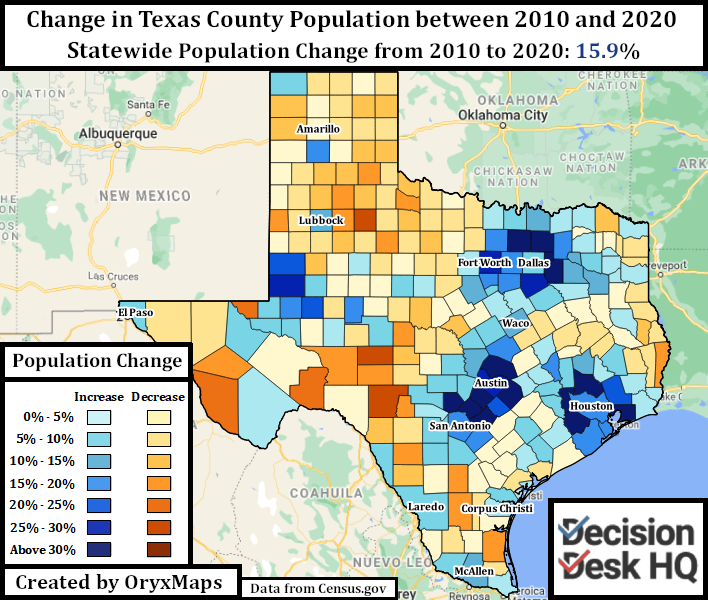
Suburbs continue to have some of the highest percentage growth rates in the nation. The fastest growing county in Virginia is the Washington D.C. suburb of Loudoun County, and the fastest growing county in Texas is the Austin suburb of Hays County. The largest suburban counties adjacent to Columbus Ohio, Indianapolis Indiana, and Des Moines Iowa saw growth rates incomparably higher than anything else in their stagnant states. Land and property remains cheap in the suburbs, encouraging development and expansion for new residents. Suburbanization is now a multi-ethnic project, with the White percentage of the population in the fastest growing suburbs uniformly decreasing.
The retiree mecca of The Villages, Florida, was the fastest growing multi-county metro area in the nation. This is not a trend exclusive to The Villages or Florida. Retiree destinations along the warm, southern coast, the dry Arizona suburbs, and in scenic natural settlements like the Rocky Mountains and Vermont’s Green Mountains all grew. America’s population is wealthy and mobile, there is no longer a need to retire in-place when there are communities designed to accommodate an aging population. The states with the least number of people under 18 are now in upper New England, but Florida is not far behind.
These three trends gutted rural and post-industrial communities near-uniformly across the United States. Younger people with prospects left for areas with opportunity, the elderly left for tranquil retirement, and those who remained watched their communities disappear. The population exodus from rural America is itself an effect of the globalization of the job market, the outsourcing of traditional industries, the decline of “main street” in favor of big box stores, the proliferation of opiates, and other localized crises. The rural areas that grew since 2010 are unsurprisingly areas with numerous jobs – usually in extraction or the oil industries – are scenic and home to retirees and vacation homes, or have new, large Hispanic populations employed in agriculture.
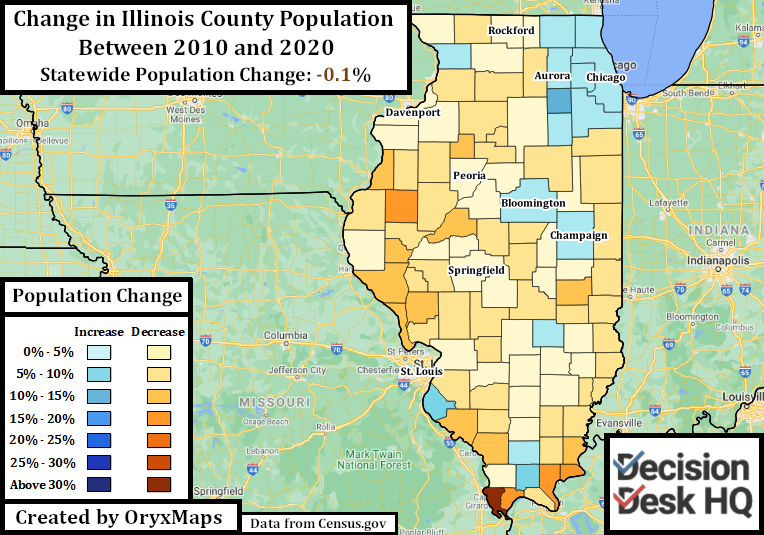
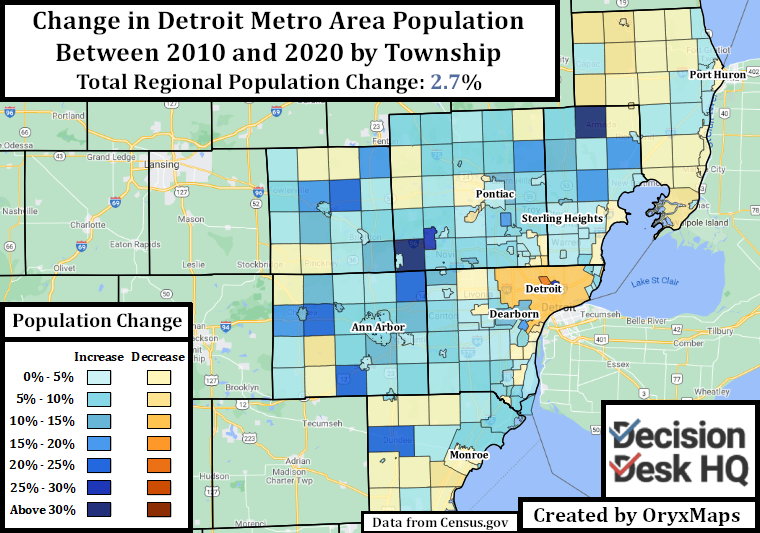
Not every urban county in the United States grew since 2010. Four that shrunk are Baltimore City Maryland, St. Louis City Missouri, Milwaukee County Wisconsin, and Wayne County Michigan – home to Detroit. These cities all have large African American populations and provide evidence of the neighborhood trends occurring in most northern African American neighborhoods. Alexander County Illinois, home of Cairo and its once-sizable African American population, lost the most residents by percentage of any county. No rural county in the Black Belt – named for its sediment rich soils and not the demographics of its residents – grew from 2010. African Americans are leaving for both southern cities and their suburbs in what has been called the New Great Migration. The lack of opportunity and structural disadvantages in some northern metro areas incentivize movement to areas where other members of their community found opportunity.
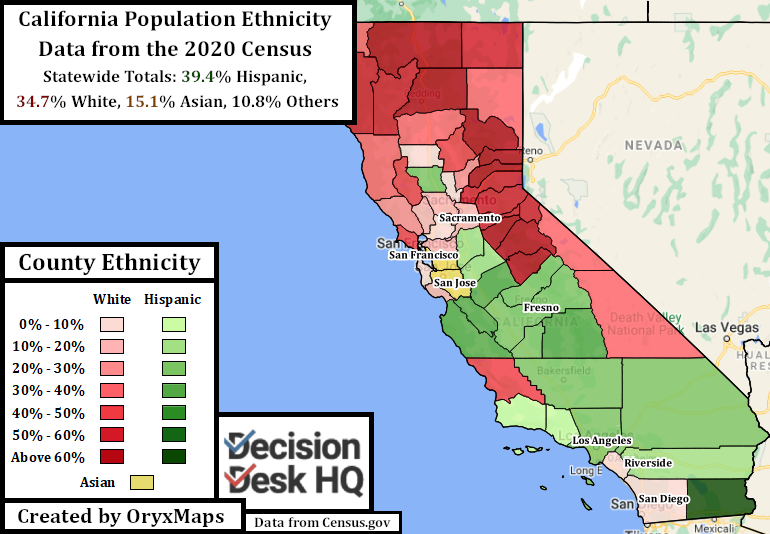
The non-Hispanic White population of residents declined from 63% in 2010 to 57.3% in 2020. This is partially because of a change in how the census measures ethnicity, and partially because of a growth into multi-ethnic identification. Diversity however remains the prominent driver of overall population growth. California is now plurality Hispanic, Maryland and Nevada are now majority-minority, and all states saw an increase in the non-white share of the population. Some of the fastest growing areas are places like suburban Fort Bend County Texas, where only 30% of residents are non-Hispanic White. Asian Americans were the fastest growing group in America, growing by 35% from 17.3 million to 24 million. Three counties in the lower 48 states – Queens in New York City and the San Francisco Bay Area counties of Alameda and Santa Clara – now have a plurality of Asian American residents.
This is the official demographic data that will be used for 2020 redistricting. The hollowing out of rural areas in favor of urban and suburban ones nominally helps Democrats – 60% of the population lives in counties won by Biden and Democratic counties accounted for 65% of the nation’s growth. Rural areas shrunk by more and urban and suburban areas grew by more than previously accounted for by the American Community Survey estimates. The partisan trends in these areas are the result, and not the cause, of the long-term population trends. Those familiar with the political geography of the United States are already familiar with these trends – most importantly how large, growing suburbs are trending Democratic. This matters for drawing districts; the county with the most Trump 2020 voters is Los Angeles California, but these voters are trapped within seats dominated by their Democratic neighbors. Gerrymandering can counteract, amplify, or correct for a locality’s partisanship, and the release of the census data heralds the start of the redistricting cycle.
Ben Lefkowitz (@OryxMaps) is a Contributor to Decision Desk HQ.