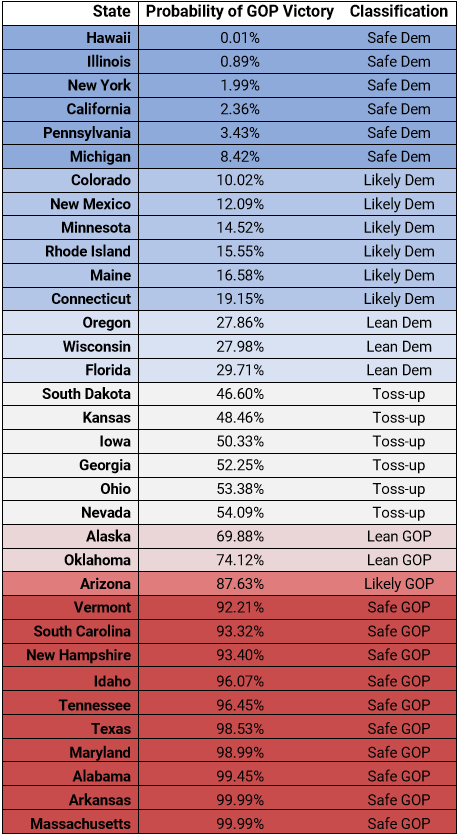
As we head into the final weekend before Election Day, we’re excited to reveal our gubernatorial probabilities. While we did not apply our House and Senate methodology to produce a full gubernatorial model, we wanted to release our take on where these races stood. We settled on a polling model, similar to what we use to input polling into our House and Senate models. Think of it as a “polls-only” model.
Here’s how it works: we collected all available polling data since Labor Day for each of the 34 governors’ races with polling in this time period (Nebraska and Wyoming are the two exceptions; they are both widely considered Safe GOP). We then run these polls through a model that uses historical polling probabilities to convert raw polling results into accurate probabilities of victory based on those results (e.g If your polling average is x and this is based on y number of polls with a margin of error of z, you win alpha percent of the time).
There are no structural, campaign finance, political environment, or candidate trait variables here; it is a probabilistic aggregation of available polling.
The table below shows where these races stand based on public polling, from most Democratic to most Republican. We incorporated all polling we could find through November 1st.
