Arizona’s 2nd has suffered an acute case of whiplash, going from one of the most competitive seats to a secured Republican victory in 2016, and now looking to zoom back to a comfortable Democratic win in 2018. While most of the handicappers rate this at least Leans Dem, and may move leftward before the election, this analysis will not dispute that but instead look at how a double-digit swing swings perfectly normal. And it’s also the story of why rather than red or blue, the defining color for this district is green.
District Overview:
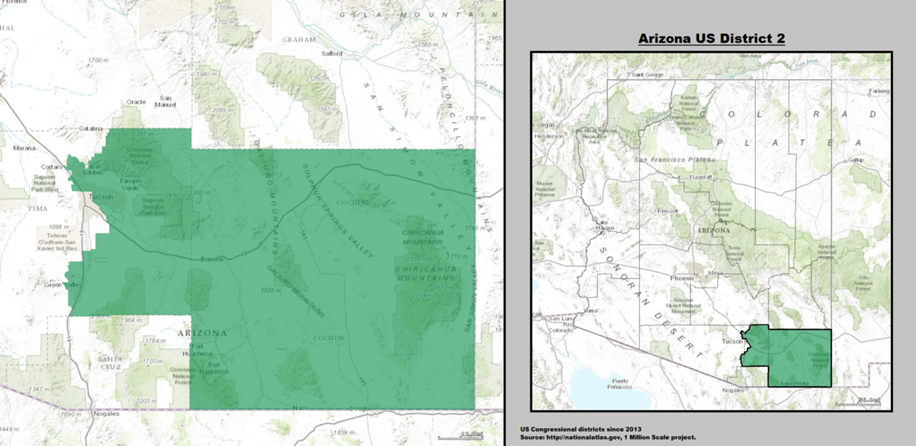
Arizona’s second is comprised of all of Cochise county and an Eastern chunk from the much more populous Pima county. Overall, Cochise typically makes up a little over 16% of the voting bloc here while the Pima slice, though smaller geographically, dominates with the other 84%. It rests in Southern Arizona, directly touching the Mexican border. Arizona’s lines were drawn by an independent commission, though the growing influx of people to Arizona has thrown the population distribution currently off and this district will likely look a lot different next time around.
The Fundamentals:
This district has remained a tight one, decided by plurality wins and then turning left last cycle a bit. In 2008, McCain won the district 49.8-48.9% and then Romney had an almost repeat performance 49.94-48.4%. This makes sense as Arizona stayed at an 8.5% Republican win in 2008 and a 9% Republican win in 2012 of 53.5-44.5%. However, in 2016, Arizona shifted leftward though it was purely because of a Republican drop statewide, with a win of only three and a half points of 48-1.44.6%. This district looked about the same statewide with only a very small Democratic growth, as Clinton won it 49.6-44.7%.
The chart below shows in the Cochise and Pima regions how the Republican top of the ticket, so presidential and gubernatorial, did and how the congressional Republican did.
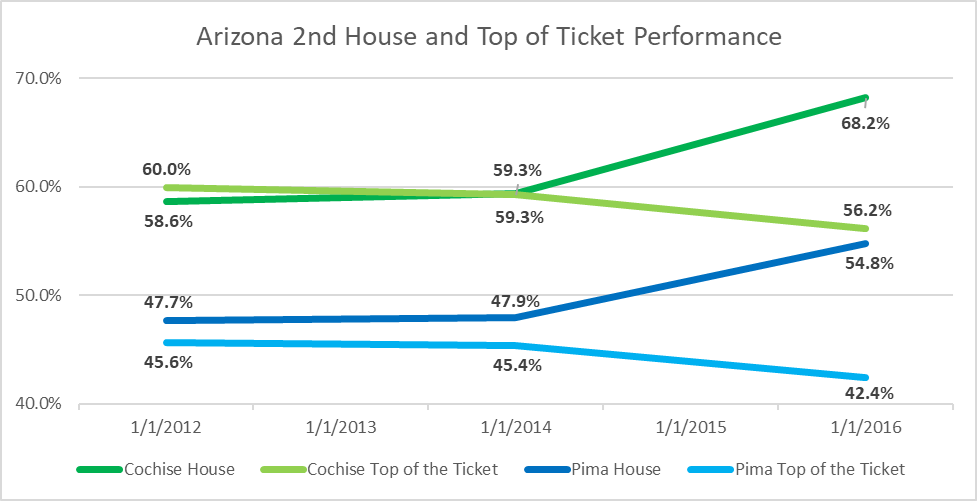
In 2012 and 2014, the pattern was clear: slight Republican overperformance in Pima and performing the same as the top of the ticket in more Republican Cochise. The share also held the same in both those cycles. But 2016 saw a sharp turn away from that, with 3-point drops in the Republican share in 2016 as the whole state moved. Yet freshman Representative Martha McSally, currently the Republican nominee for the Senate who vacated the seat.
One of the key factors in this race is that over 20% of the seat is Catholic. The chart below shows all the Southwest congressional districts plotted out by the share of the district that identifies as Catholic vs. how well they perform vs. the top of the ticket. Positive means that the district is more Republican for Congress, while negative is more Democratic.
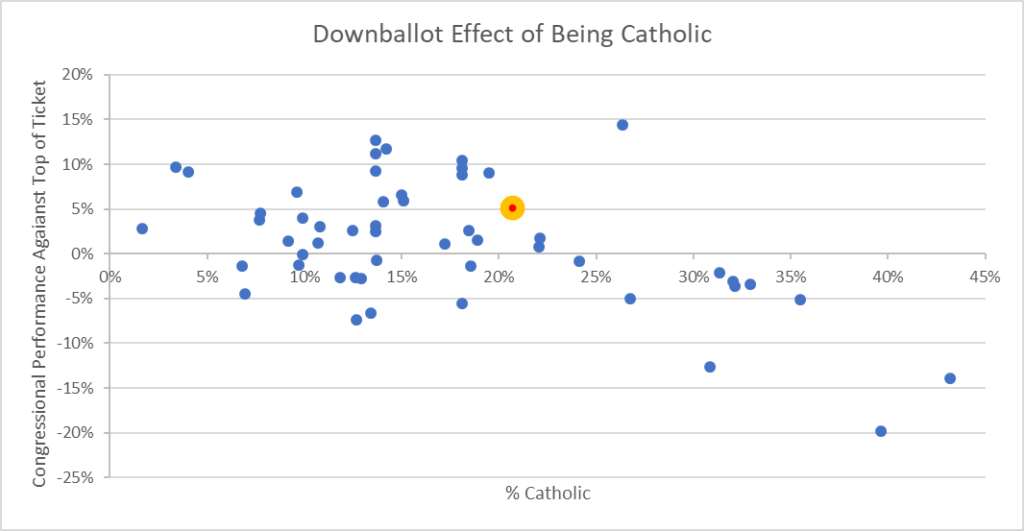
While most are clustered, some of the higher shares tend to become more Democratic in their vote for Congress and AZ-2 currently rests above the trendline. This could be helped by the fact that Martha McSally is Catholic and this time around, Democratic nominee Ann Kirkpatrick is also Catholic. Appealing to this large share of voters is a political boon in the area.
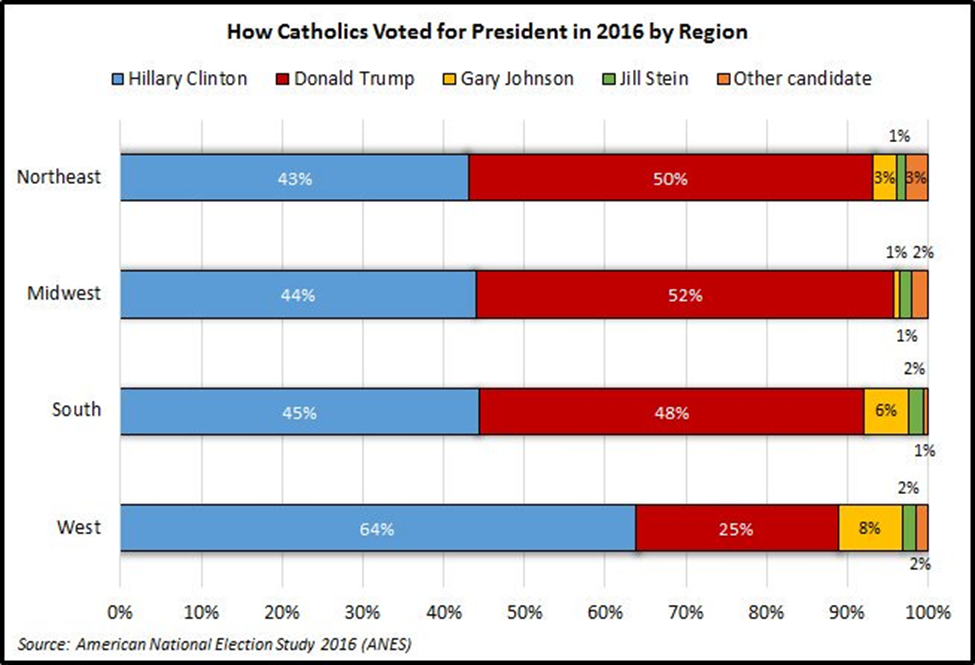
The ANES, a huge survey of voters, also asked about religion and found that among Catholics, Western Catholics were far more likely to pick Clinton. They also had the highest share of 3rd party voters, and as those seem to turn away from the party in power, the shift among this community will probably be larger in 2018.
Why the Huge Split?
The biggest question is how Martha McSally, against the grain, could have won by double digits and only 2 years later this district snaps Democratic so fast. The biggest answer here is money. In 2012, the Democratic candidate spent $2.7 million to the Republican’s $1.4 million and outside groups spent about under $1 mil, to make it about even. Seeing how competitive it was, the stakes were raised in 2014 as challenger Martha McSally spent $4.5 mil and the Democrat dropped $3.6 mil down.
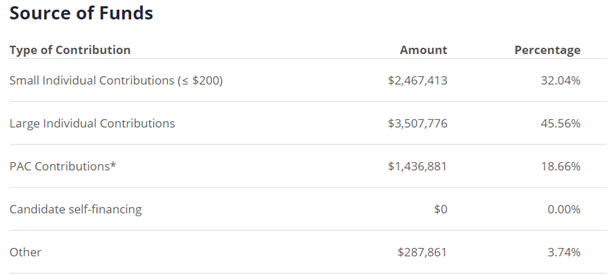
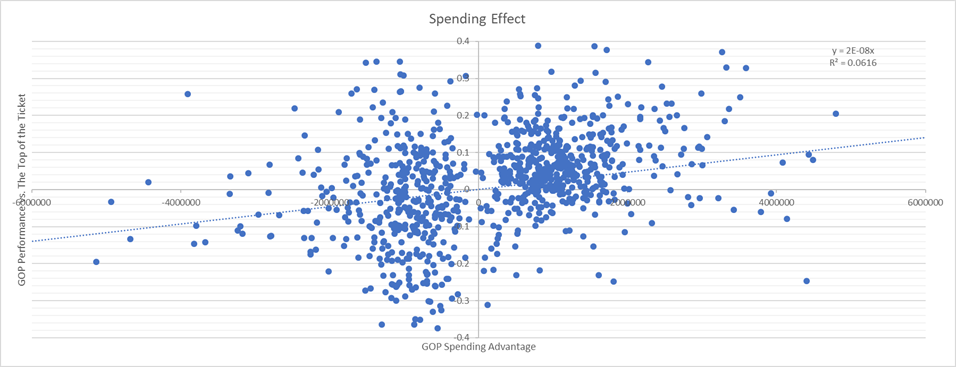
Outside groups also took notice, each side spending about $5 million, until the total cost of the race that year hit $18,669,209.39 in total spent, with the GOP eking out a $1.4 million cash spent advantage. Before 2016 McSally, now the incumbent, immediately started raising money from a variety of sources, as seen in the chart from OpenSecrets.org to the left, preparing for the upcoming election. And then the Democrat spending just…never came. Matt Heinz would go on to spend $1.6 mil, but McSally would bury him, spending a whopping $8.7 million for a spending advantage of over $7 mil. The chart below is an extremely basic regression that shows the Republican spending advantage by district plotted against the performance vs. the top of the ticket. It’s busy, but roughly translates to the need to outspend by $500,000 to move the margin one point. When looking at just SuperPACs, that falls to $400,000 per 1 margin point, possibly due to candidate primary spending making it cost more. McSally went on to outperform the top of the ticket by about 12%, right in line with the fundamentals of spending that much. Without any Democratic pushback, she was able to keep her numbers afloat, but it also means that there is a need to put that much money to keep this district.
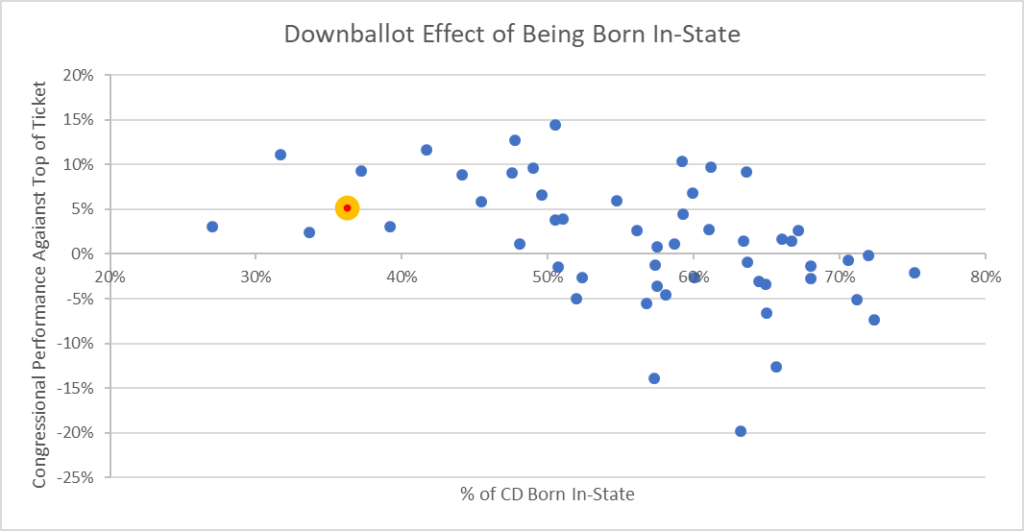
Another factor that could help with money influencing the vote is the chart below. It plots the percent of a district that was born in state to the performance vs. the top of the ticket, with positive being more Republican and negative being more Democratic. As more were born in the Southwestern congressional districts, it would vote more Republican up-ballot and more Democratic for Congress AZ-2 is the highlighted point and shows that a lot of the district is not from there. This means that name ID is more of an issue or that it has more foreign born residents, meaning turnout may be lower and spending is needed to introduce or win them over.
The Personal Touch:
We only have one public poll from New York Times/Siena that shows the Democrat leading by a solid margin of 11 points, 50-39%. While Trump’s underwater approval of 42-54% was likely a driving factor, Kirkpatrick’s lead of 19 points among women and a 17 point lead among whites with a college degree to propel the margin.
The Republican:

The Republican is Lea Marquez Peterson, the President and CEO of the Tucson Hispanic Chamber of Commerce, as well as serving on nearly a dozen business boards and is active in the national CoC branch. Despite a stellar resume, ties to the governor and to the business community, she only raised about $773,000 as of August and the National Republican Congressional Committee pulled its $400k ad reservation from the market recently. Though her resume is strong, Peterson is now on her own and fighting an uphill battle, though that hasn’t stopped her from aggressively going after Kirkpatrick, especially on the charges of carpetbagging into the district, against her 40 years in the area.
The Democrat:
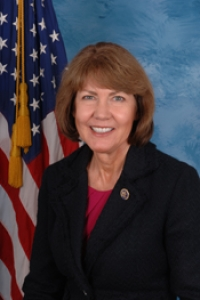
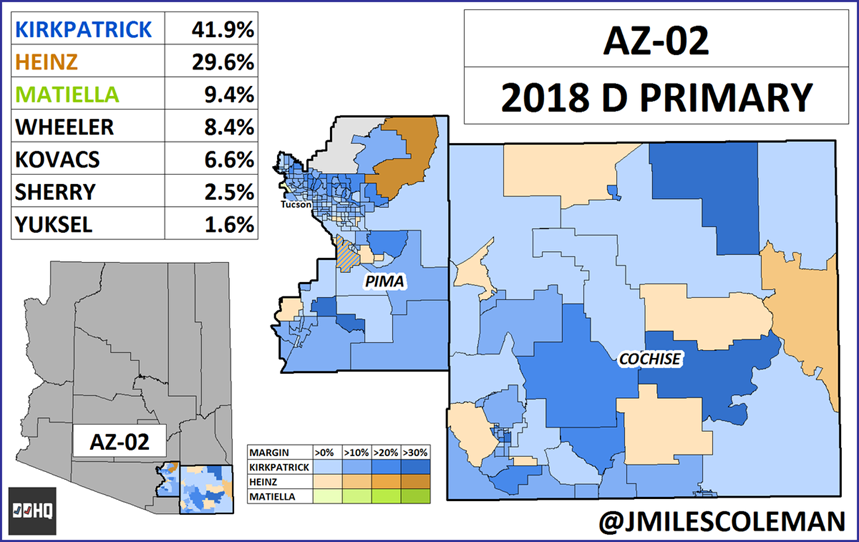
Ann Kirkpatrick is the former representative from the nearby 1st district. She has a shaky record winning in 2008 before being knocked out a cycle later. After redistricting, she returned to win a narrow 9,180 vote plurality win in the redrawn district, and then held on by 5 points in 2014. In 2016 she ran for Senate against John McCain, losing handily statewide by 13 points. With Democrat Tom O’Halleran securely in his spot in her old district, she moved east to AZ-02. It was a bitter primary where the DCCC stepped in on her behalf against 2016 Democratic nominee Matt Heinz, who likened her need to be elected to that of a meth addict. The map below, by Decision Desk’s own Miles Coleman, shows the AZ-2 primary where Kirkpatrick prevailed (the final margin was Kirkpatrick 41.4%-Heinz 30.6%). As of August she had spent $1.6 million with another $335k on hand.
The Others:
There are none (sheds solitary tear)
The Verdict:
As this seat shows hints of moving leftward, especially in a bad year for Republicans, it will have to be like 2016, with a huge buy-in to even get onto the table. Not willing to commit the same resources McSally was able to muster up last cycle means that this seat very likely flips, and unless you’re bringing the guns to bear in 2020, will remain there until the next redistricting cycle. The Øptimus model gives Kirkpatrick a 54.2% chance of flipping the seat.