LAST UPDATED: November 24th, 2020
Introduction
In this post, we’ll be presenting a preliminary analysis of the DecisionDeskHQ/Øptimus forecast for the 2020 General Election (following on a similar analysis for the 2018 midterms). It’s been a riveting year for elections and forecasts across the board, and we’re happy with the model’s performance.
Here’s an outline of what we’ll be covering –
- Model Overview – This was DecisionDeskHQ and Øptimus’ first public Presidential model, and it successfully predicted 48 out of 50 individual states. Additionally, the Electoral College simulations’ mean was within 12 electoral votes of the final outcome. The Senate model performed at par with other forecasts, and was overly bullish on Democrats. The House model was quite conservative and came closest (of the quantitative forecasts) to the true number of seats that Democrats will win (237, compared to actual of 222-223), but was similarly bullish for Democrats.
- Comparison with Other Quantitative Forecasts – We go over performance of competing forecasts (including FiveThirtyEight, The Economist, Princeton and JHK), and see how well we stack up. Depending on the metrics used, our model consistently performed at the top or near the top of the pack.
- Comparison with Qualitative Forecasts – We talk about comparing performance with firms such as Cook and Crystal Ball. Kudos to Crystal Ball for nailing 49 out of 50 presidential states. Presented as a qualitative forecast, we performed quite well in the House (9 “misses”, while established qualitative ratings missed between 7 and 18).
- Polling and its Effects – One can’t evaluate a forecast in 2020 without talking about the polls and their relatively historic misses (especially in the upper Midwest). We share our initial thoughts on polling.
In our preliminary analysis, we’re going to include all of the races we know about as of Nov 11th, 2020. This includes all of the Presidential races, all but the two Georgia Senate races (that have gone into runoff), and 430 out of the 435 House races. Once all the results are in, we’ll make an update and revise some of the numbers presented below.
Our final Presidential prediction had Joe Biden with an 87.6% chance of winning the Presidency. The predicted mean electoral votes across our simulations was 318 with a 95% confidence interval spanning from 268 to 368. The Presidency was called for Joe Biden on Friday Nov 6th by DecisionDeskHQ, with most large news outlets calling it a day later on Saturday Nov 7th. Joe Biden won with small leads in MI, WI, PA, and GA, and will end up with 306 electoral votes.
Our final Senate prediction gave Democrats an 82.9% chance of winning the Senate, with a 9.9% chance of a tie (50-50 chamber). The mean prediction was 52 Democratic seats to 48 GOP seats with a 90% confidence interval spanning between 45 and 50 GOP seats. Control of the Senate has yet to be called due to the two Georgia races that went into runoff and will be resolved on Jan 5th, but it will end with between 50 and 52 seats for the GOP.
Our final House prediction gave Democrats a 98.3% chance of winning the House. The mean prediction was 237 Democratic seats to 198 GOP seats with a 90% confidence interval spanning between 187 GOP seats and 210 GOP seats. Although we don’t have a final split of House seats, it appears that Democrats will end with roughly 222-223 seats and the GOP will end with roughly 212-213 seats.
Many quantitative (and even qualitative!) forecasts rely heavily on polling, and 2020 demonstrated a fairly large polling error that ranged between 2-12 points in swing states (average of 6 points across Senate and Presidential polls). The polling error systematically favored Democrats across the board. This led to an inflation of Democratic chances in both House and Senate forecasts, while also causing every quantitative Presidential forecast to predict Florida, North Carolina, and Maine-2 on the “incorrect” side of 50%.
Compared to other publicly available forecasts, the DDHQ/Øptimus model offered one of the most accurate sets of predictions overall. For example, our Presidential model had a projected EV total of 318 electoral votes for Joe Biden, fewer than either FiveThirtyEight (348) or the Economist (350). This was only 12 electoral votes off from the actual outcome of 306. For these comparisons, we utilized other forecasters’ mean predictions where available, or their projected (mean or median) totals when not specified.


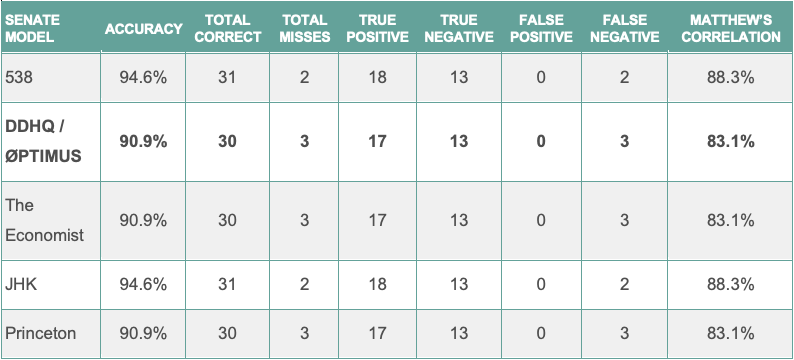
Our model – and virtually everyone else’s – struggled in the Senate. We predicted Democrats to win a mean of 52 Senate seats, a far cry from the 48-50 they will ultimately end with. This prediction places us on even-keel with several other forecasters, including FiveThirtyEight and the Economist. The size of the miss is largely a consequence of polling error. Polls substantially overestimated Democrats’ position in several key states, including North Carolina and Maine. Maine represents the single largest polling miss of the cycle: Democrat Sara Gideon entered election night with a 3-point polling average lead, but incumbent Republican Susan Collins was ultimately re-elected by over 8 points. This came as Joe Biden carried the state of Maine by more than 9 points. Our model was challenged by the large polling error. Inaccuracies in other Senate races – like North Carolina – were the result largely of underlying polling errors. In the final 100 polls of the North Carolina Senate race, Thom Tillis led in 2. Despite these challenges, DDHQ/Øptimus still offered one of the best publicly available models: we missed only two Senate races, and only one forecast came 1 seat closer to predicting the true number of Democratic senate seats .
The DDHQ/Øptimus forecast led the field in predicting the ultimate number of Democratic House seats, though all quantitative forecasters again overestimated Democratic strength. Our model predicted 237 seats, in contrast to the 222-223 seats Democrats now appear poised to win. The House forecast was again hurt by polling, with Democrats in districts like Iowa-1, Illinois-13, and Arkansas-2 underperforming their polls by more than 6 points.
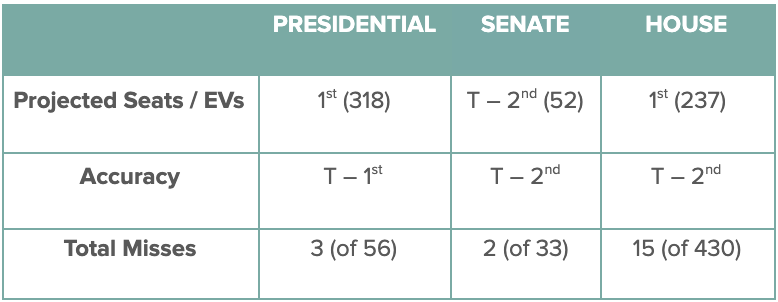
The DDHQ/Øptimus forecast came first in projected Electoral Votes for Presidential (by a large margin) and tied for first in accuracy and number of missed seats. In the Senate, it was tied at 2nd place across the board. In the House, it came closest to the number of seats Democrats will gain, and as of now is tied for 2nd place for accuracy.
An elaborate breakdown of the performance of different quantitative models is available in the table below.
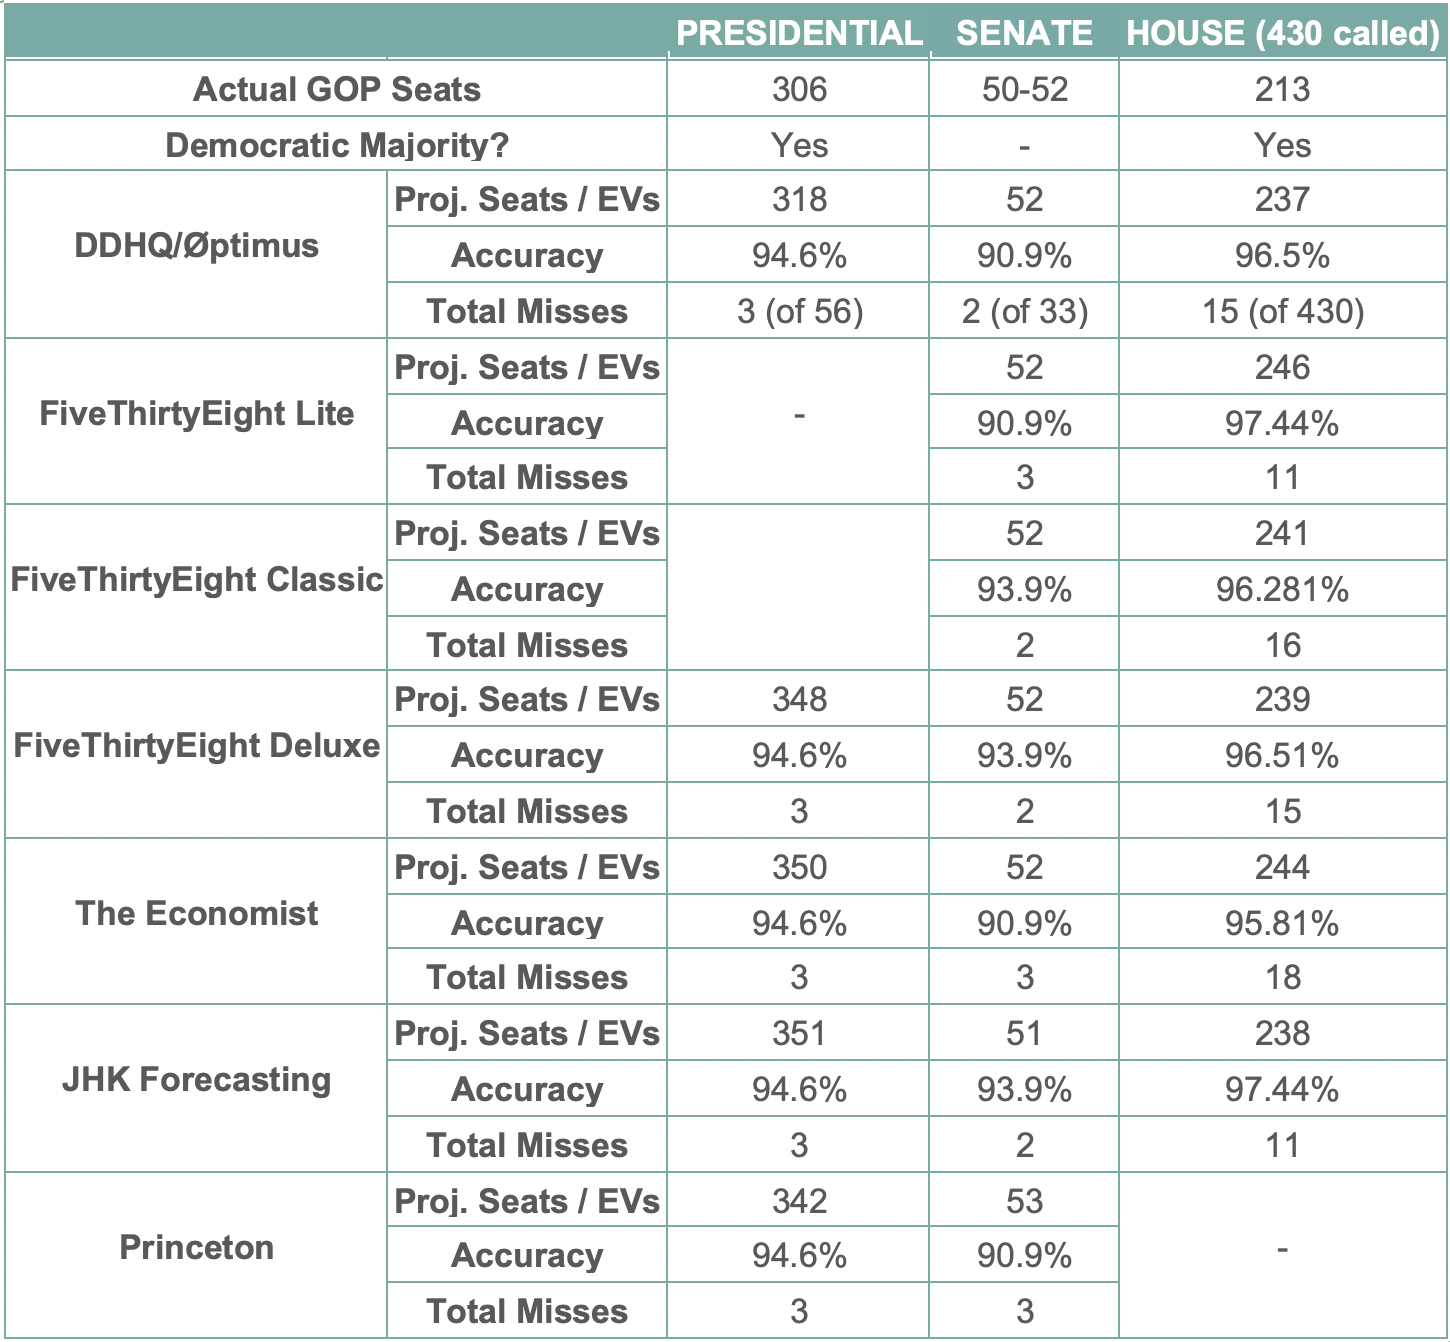
The three consistent misses in every Presidential forecast were Florida, North Carolina, and Maine-2. These three state-level units saw polling errors of 6 points, 3 points, and 9 points respectively.
In the Senate, the consistent misses across the board were Maine, North Carolina, and Iowa, with some forecasts barely tipping over the edge of ‘correctness’ with Iowa. These races suffered polling errors of 12 points, 5 points, and 9 points respectively.
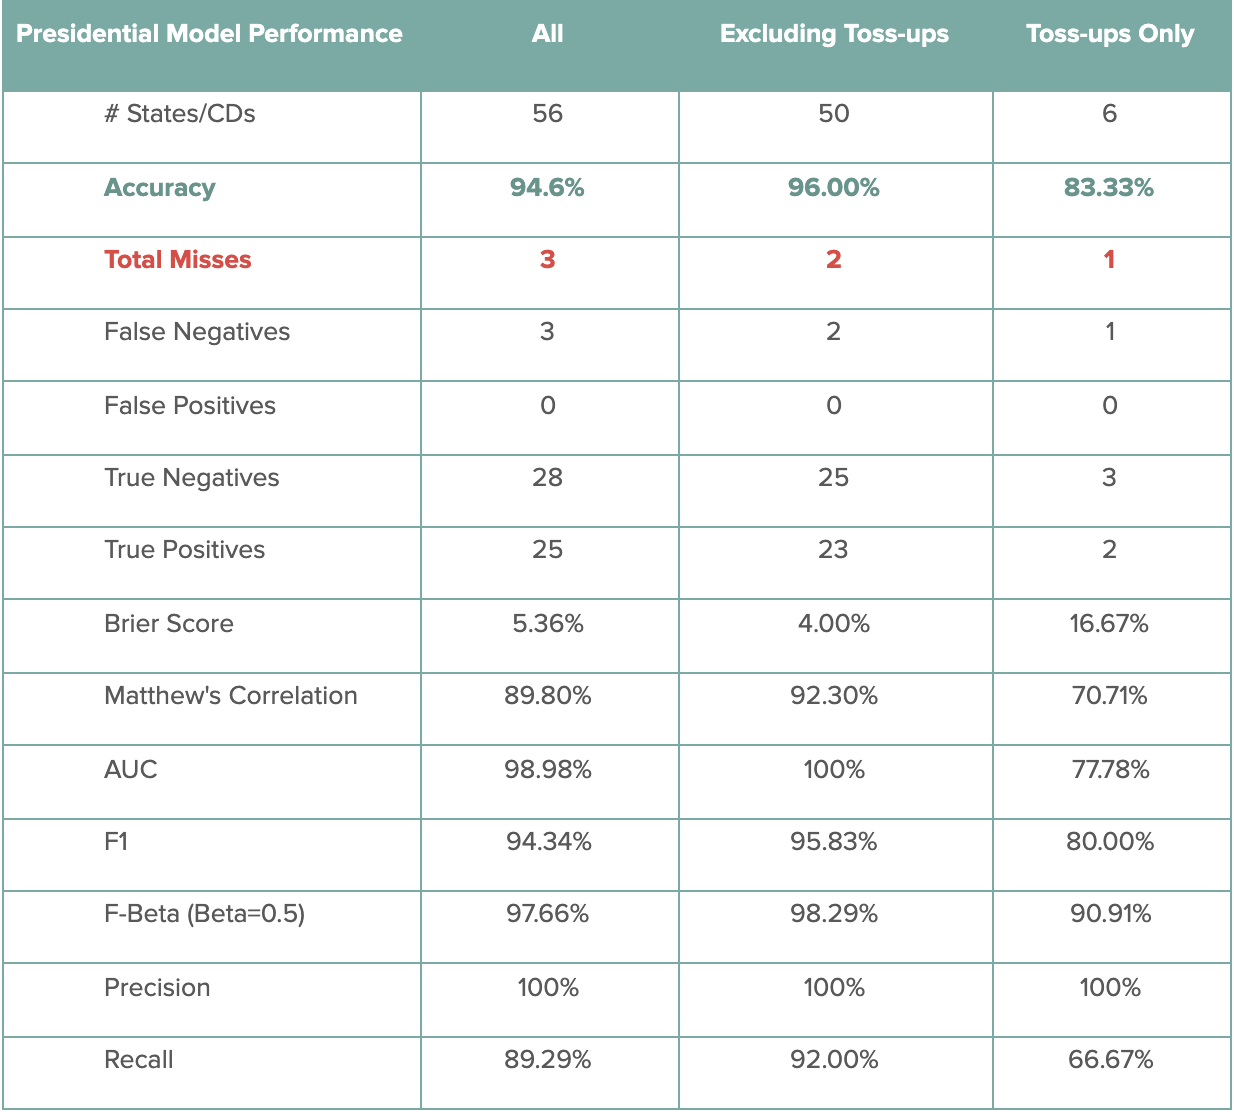
Presidential Model Performance
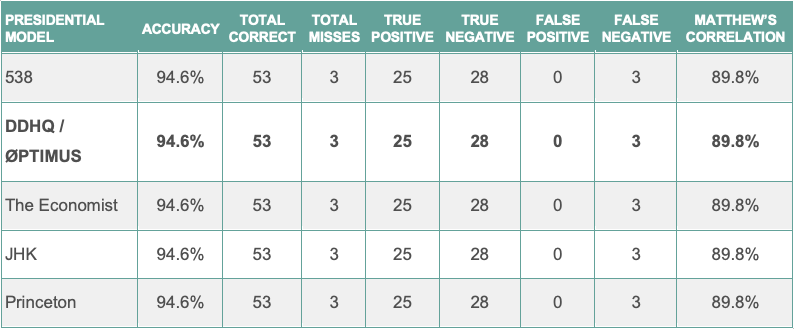
The following table contains the performance scores for the DDHQ/Øptimus Presidential model. For the 56 races tracked (50 states, plus DC and NE/ME congressional districts), the DDHQ/Øptimus Presidential model called 53 correctly, producing an accuracy metric of 94.6%. Among the 6 toss-ups, the model predicted 5 correctly, producing an 83.3% accuracy among these races. Excluding the toss-ups, the Presidential model had an accuracy of 96.0%, predicting 48 out of 50 non-toss-up races correctly. The only races incorrectly predicted were Florida, North Carolina, and Maine’s 2nd congressional district.
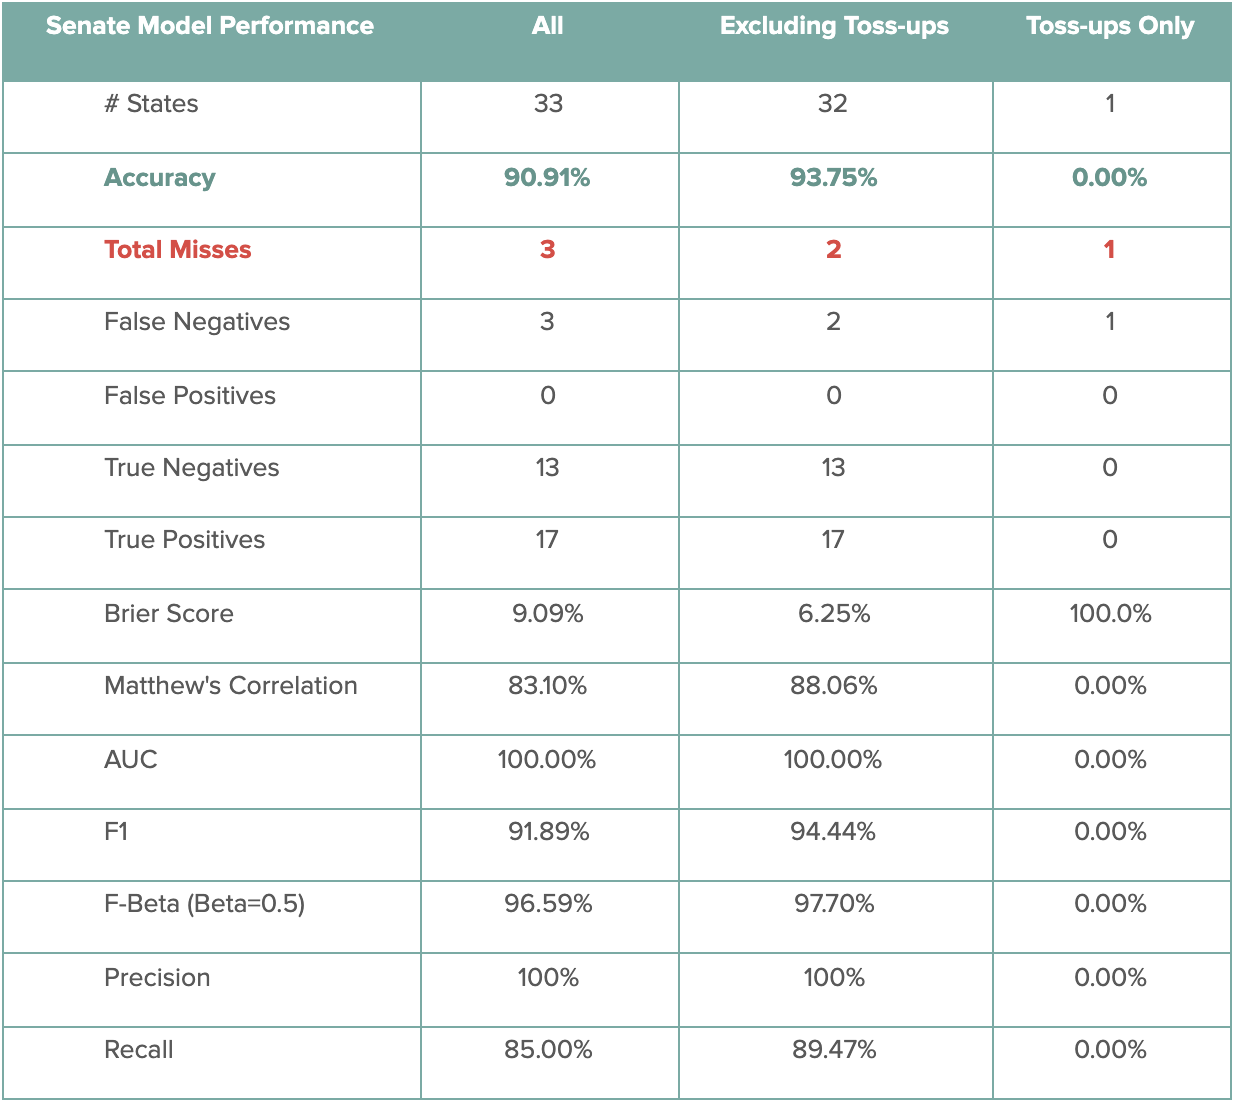
Senate Model Performance
The following table contains the performance scores for the DDHQ/Øptimus Senate model. Among the 33 called Senate races, the DDHQ/Øptimus Senate model called 30 correctly, producing an accuracy of 90.0%. While the model incorrectly predicted the only toss-up Senate race – Iowa – the model correctly predicted 30 out of 32 non-toss-up races, for an accuracy of 93.7%. The two misses – Maine and North Carolina – were commonly missed as a consequence of widespread polling error.
House Model Performance
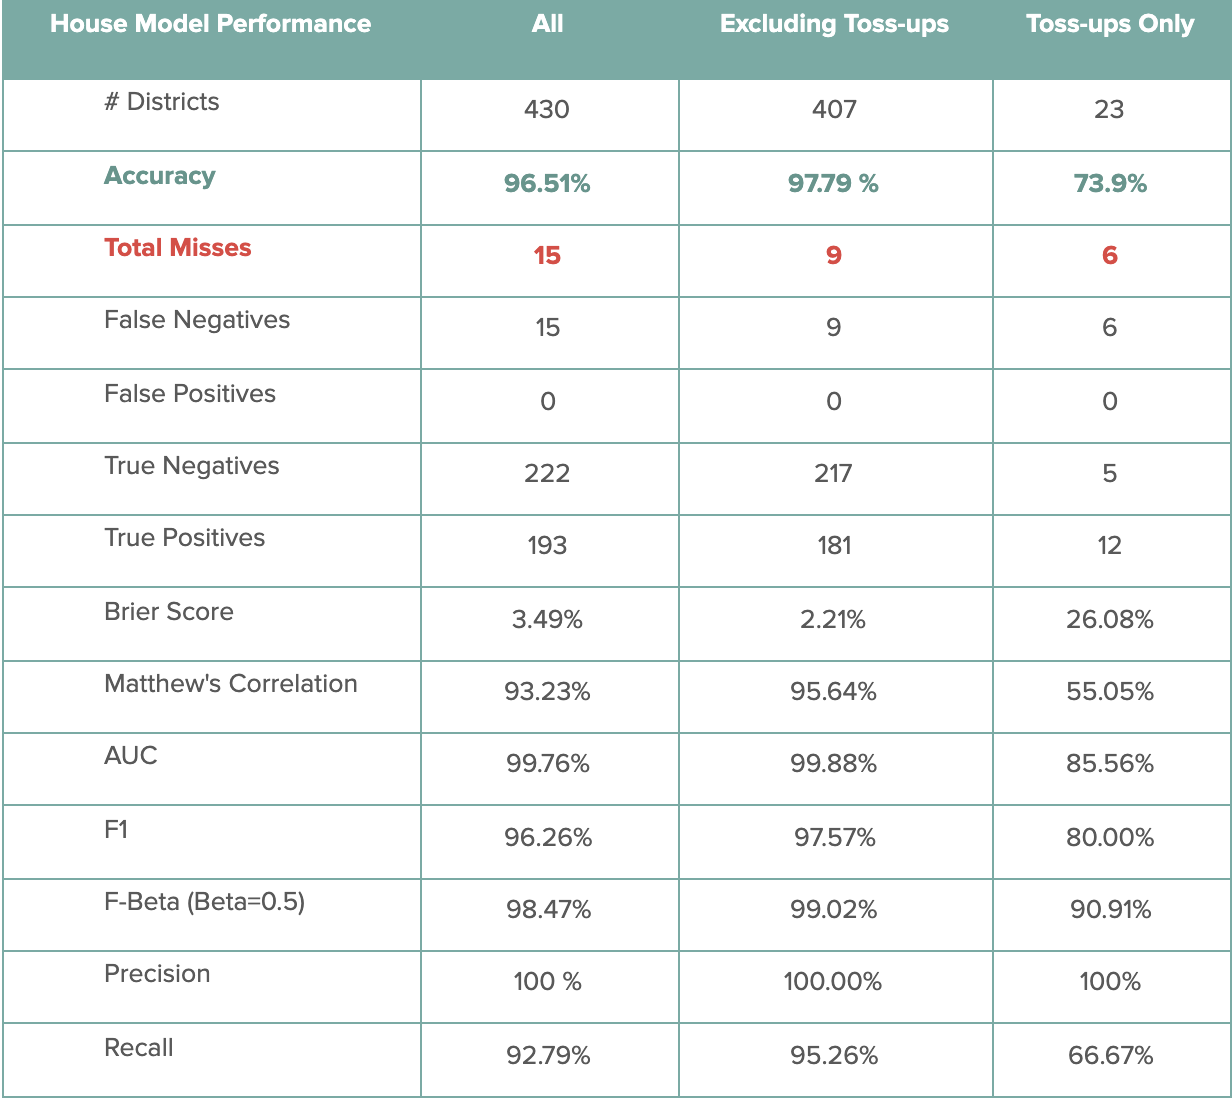
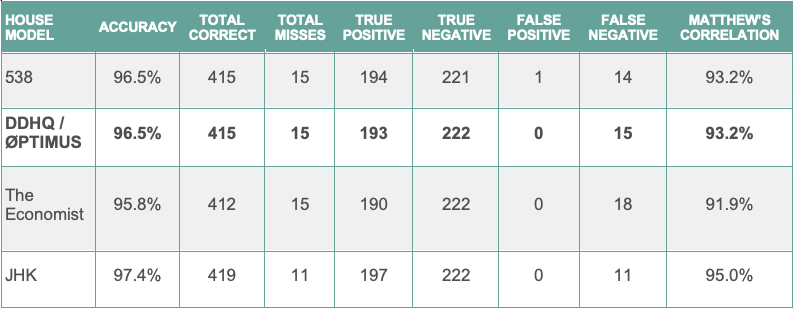
Finally, the following table contains the performance scores for the DDHQ/Øptimus House model. As of November 21st, among the 430 races called by DecisionDeskHQ, the DDHQ/Øptimus House model predicted 415 races correctly, signifying an accuracy metric of 96.5%. Among the 23 toss-ups, the model predicted 16 races correctly, producing a 73.9% accuracy metric among these races. Excluding the toss-ups, the House model was 98.5% accurate, correctly predicting 391 out of 396 non-toss-up races. Some of the non-toss-up districts where the model missed include districts like Iowa-1 and New York-22, where polling strongly underestimated Republican strength.
Polling Errors
Typical polling errors in 2020 were even larger than those experienced in 2016. Our forecast heavily incorporated polling data, and inaccuracies in our model can be largely traced back to underlying polling errors. This problem persisted across the Presidential, Senate, and House races.
President
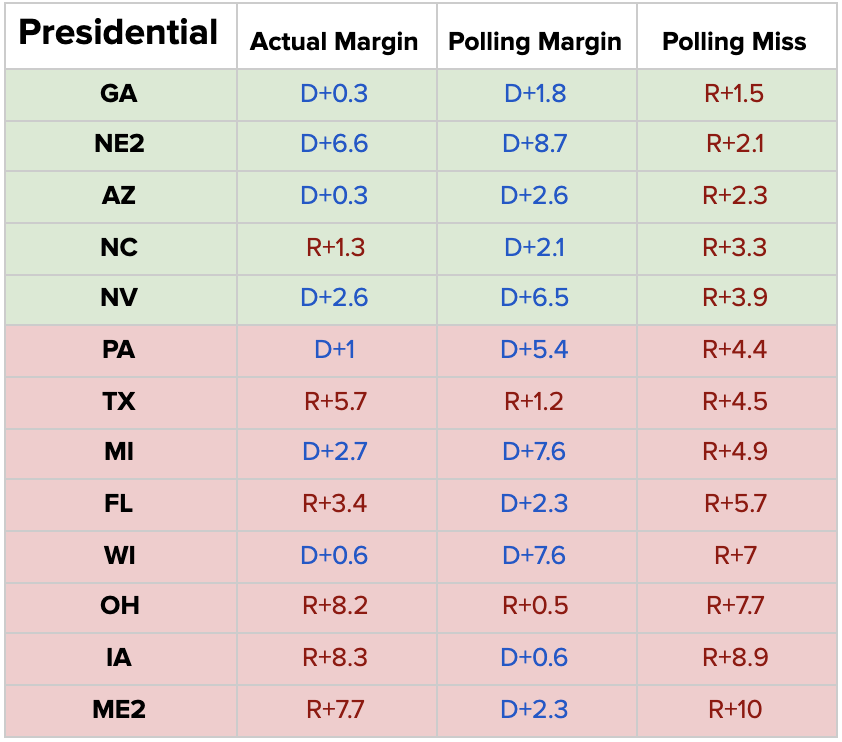
Going into Election Day, the average state-level polling average in our model was biased 5 points in favor of Joe Biden. As a result of this discrepancy, our model was overly bullish on Biden’s odds in a number of states. This perhaps showed itself most clearly across the upper-midwest. In Wisconsin for example, we gave Joe Biden a 78.6% chance of winning. Biden did ultimately carry Wisconsin, but by a margin of less than a single point. Other states tell a similar story: polls were almost uniformly too optimistic about Biden’s chances, and as a result our model was as well.
Senate
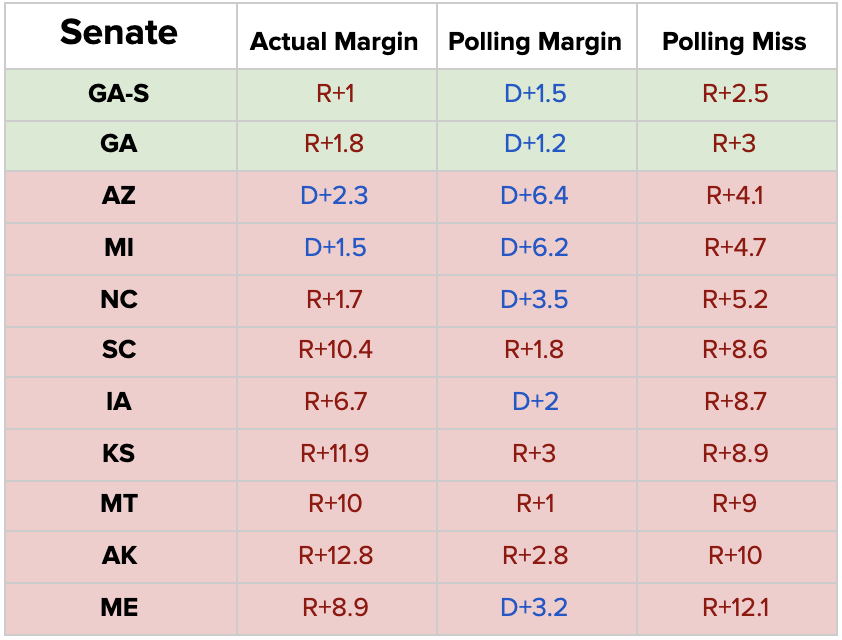
The high-level story of polling in the Senate resembles that of polling for the Presidency. Going into the election, our state-level Senate polling averages were biased about 7 points in Democrats’ favor. Senate Republicans outperformed their polling average in every state where Senate polling existed. This effect existed even in states where it wasn’t enough to get Republicans over the finish line: in Arizona, incumbent Republican Martha McSally trailed Mark Kelly by almost 7 points in our polling average. Kelly ultimately won by 2 points.
As a result, our forecast – alongside every other major forecast – substantially overestimated Democrats’ Senate standing. We projected Democrats to end with a mean of 52 Senate seats. Pending the January runoff elections in Georgia, Democrats are likely to end with as few as 48.
House
As in the Presidential and Senate races, polling substantially overestimated Democratic performance in the House as well. Many viewed continued Democratic control of the lower chamber as a foregone conclusion, and expected Democrats to even expand their majority. It came as a surprise when instead Democrats not only lost nearly every competitive district they had targeted, but saw a massive share of their 2018 House gains erased as well. Freshman Democratic incumbents in Republican-leaning districts like Iowa-1, Oklahoma-5, and New York-11 were all defeated. Polling substantially overstated Democratic standing in each of these districts. Democrats similarly underperformed their polls across the country:
On average, Democrats underperformed their polling average by roughly 7 points in the House. As a result, we projected Democrats to end with a mean of 237 House seats, while FiveThirtyEight predicted 244 Democratic House seats. Democrats are currently on track to end with roughly 222-223 House seats.
Polling/Non-Polling Analysis
Given the size of the polling error, it’s interesting to ask how our model would have performed in the absence of any polling input, using only things like FEC data and demographic information. Because polling was generally so inaccurate, this approach would have significantly improved our prediction in a number of key races. For example, our model – incorporating polls – gave Iowa Republican Joni Ernst only a 49.6% chance of being reelected. If we had simply removed polling from our model, we would have given Ernst a 66.1% chance of being reelected.
Similarly, our model – including polls – gave Donald Trump a 21.4% chance of winning Wisconsin, while our model without any polling would have given Trump a 38.8% chance of victory. Given the narrowness of the final result in Wisconsin – Biden prevailed by less than a single point – the polling-free result may have better reflected the state of the race. Overall, our purely structural model would have projected 50.6 Senate seats for Democrats, 1.4 seats closer to the actual result than our final forecast. Similarly, a purely structural prediction would have forecast 303 electoral votes for Joe Biden, and 232 seats for House Democrats, both even closer to the actual final result.
Comparison with Quantitative Models?
In the Presidential race, every major forecast incorrectly predicted the same set of 3 races: Florida, North Carolina, and Maine’s 2nd congressional district. Every model incorrectly predicted Joe Biden to win in these areas. In terms of mean/projected electoral vote prediction, there was more variation. The DDHQ/Øptimus model led the way with a prediction of 318 electoral votes for Joe Biden, a miss of only 12 from the actual result of 306. FiveThirtyEight projected 348, while the Economist’s mean was 350. Our more conservative prediction is a consequence of our more conservative state-level probabilities. In Wisconsin for example, we gave Joe Biden a 78.6% chance of winning, while FiveThirtyEight gave him a 94% chance of winning. Our lower odds in most cases more closely reflected the state-of-play in these states, ultimately producing a more bearish prediction for Biden.
In the Senate, every major quantitative model – DDHQ/Øptimus, FiveThirtyEight, the Economist, and JHK Forecasting – missed between 2 and 3 Senate races, all incorrectly predicted for Democrats. The models can be broadly divided into two groups: those that missed Iowa, and those that did not. Both DDHQ/Øptimus and the Economist predicted Joni Ernst to lose in her reelection bid to Democrat Theresa Greenfield, while FiveThirtyEight and JHK Forecasting correctly predicted Ernst’s reelection. Ernst was ultimately reelected by more than 6 points. Forecasters uniformly missed Senate races in North Carolina and Maine. Maine perhaps represents the largest single miss of the cycle, both for pollsters and forecasters. Incumbent Republican Susan Collins trailed in polls by more than 3 points, but ultimately won by more than 8 points. DDHQ/Øptimus, FiveThirtyEight, and the Economist all had a projection/mean of 52 seats for Democrats, while JHK Forecasting came closest at 51.
Finally in the House, each major forecast again substantially overestimated Democratic performance. Not a single Republican-favoring prediction by any major forecaster was incorrect. Despite continued challenges related to polling, the DDHQ/Øptimus model continued to lead, projecting 237 House seats, in contrast to 244 from the Economist, and 239 from FiveThirtyEight. Democrats almost uniformly lost races that were forecast to be competitive, obtaining a House majority much smaller than anyone predicted.
Comparison with Qualitative Forecasts?
While our model is quantitative, we also typically translate our predictions into qualitative labels so that we can more easily talk about them within a qualitative framework. It involves a simple conversion from probability to label – for example, 0 – 10% is treated as Safe Democratic, while 40-60% is treated as a Toss Up. The translation is presented below.
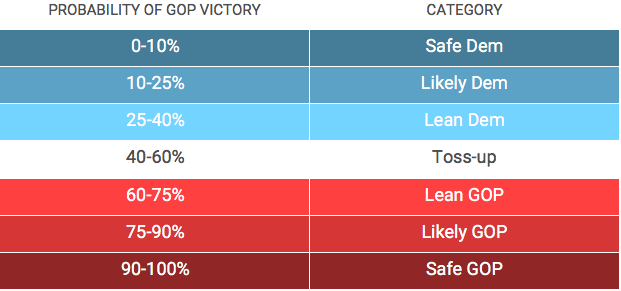
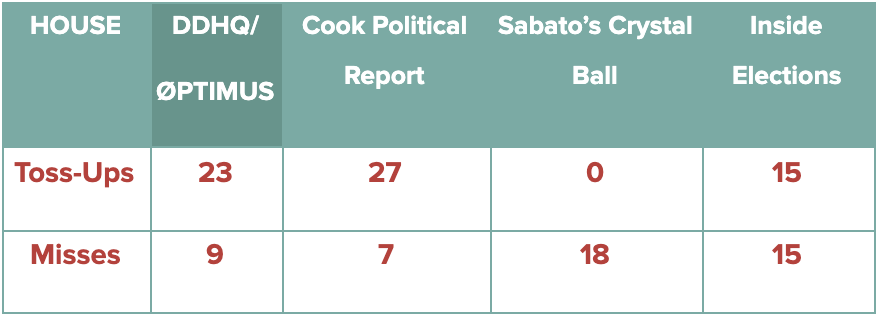
We can, therefore, perform an approximate comparison with qualitative forecasters by comparing the number of races where we incorrectly predicted the final outcome. Because qualitative forecasts typically do not indicate whether a tossup race is expected to go one way or the other, we only compare non-toss-up races in this analysis.
In the House, the DDHQ/Øptimus model performed quite well throughout the 2020 cycle, relative to most qualitative forecasts. The errors present in polling – and in broader conventional wisdom – proved as much a challenge for forecasters like Cook and the Crystal Ball as they did for our model. Among non-toss-up races, the DDHQ/Øptimus model incorrectly predicted the outcome in 9, in contrast to 7 for Cook, 18 for the Crystal Ball, and 15 for Inside Elections. In each case, forecasters struggled with the sheer extent to which Republicans outperformed expectations. For example, Republican pick-ups in districts like Iowa-1 and Florida-27 were not predicted by anyone, reducing forecast accuracies across the board.
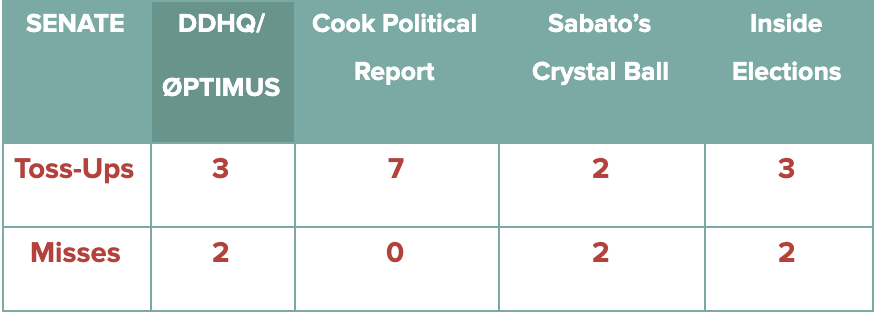
In the Senate, our forecast performed similarly to each qualitative forecast. The main difference between forecasts was whether races in Maine and North Carolina were classified as toss-ups or Democratic-leaning. Our forecast, Sabato’s Crystal Ball, and Inside Elections forecast these 2 races for Democrats, while the Cook Political Report held them at toss-up, and outside of our scoring. Outside of these two states, each qualitative Senate forecast agreed with ours across all non-toss-up races.
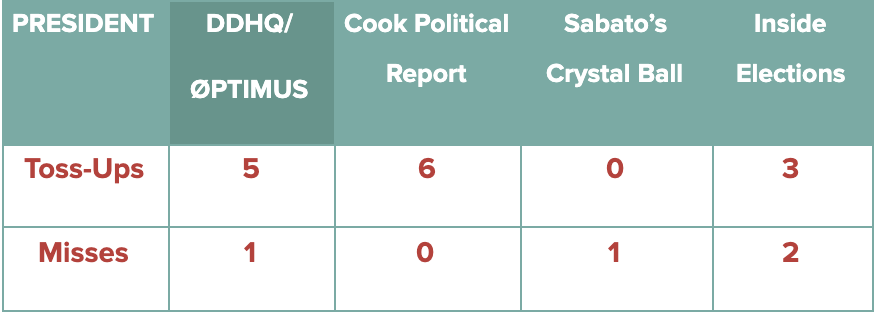
The high-level situation in the Presidential race is similar to that found in the Senate. The main Presidential disagreements were Florida and North Carolina. Our model predicted Florida for Joe Biden, while Inside Elections projected both states for Biden. Cook Political kept both states at toss-up, and as a result their forecast featured no Presidential misses.
Recap
Despite an unprecedented level of polling error, the 0ptimus/DDHQ model was generally very successful at predicting the outcome of the 2020 election, consistently coming in at the top or near the top of the pack. In the Presidential race, we successfully predicted Joe Biden’s final Electoral College total to within 12 votes, the most accurate prediction in the industry. On a state-by-state basis, we tied for the fewest overall number of misses. Despite the substantial challenges posed by polling in the House and Senate, our model was largely able to balance the polling and structural factors. While still overestimating Democratic performance in the House for example, our model did so by a smaller margin than other forecasts. Our results further our confidence in our model’s ability to predict electoral outcomes, both on the individual-seat level and in the aggregate. We will continue exploring new ways to improve our methodology, and we look forward to the 2022 midterm elections cycle.